The Edge browser provides a wide range of tools that can be used to debug or inspect a webpage, these set of tools can be used from a sub-window called Development tools or DevTools. You can check for responsiveness, performance, and network request or edit styles in the browser itself, you can also check the JS code and debug with various debugging tools provided in the DevTools window.
Benefits of DevTools:
The DevTools is a great place for developers to debug and gain useful information on their web pages. The benefits it provides to the developers are:
- Easy to Navigate around: The DevTools can easily be learned by developers in no time and developers can’t start using the tools with little to no prior knowledge. The tools are also easily accessible using the shortcut key.
- Guide & Videos: The DevTools in Edge are well documented and the team behind the DevTools with proper documentation and videos act as a guide to new users.
- Simple yet Effective UI: The UI is clean and well-organized with a proper layout. The tools have their respective tabs and in every tab, there is uniformity in the UI, so you can easily understand the UI elements of each tool.
- A good amount of Customization: The tabs in the DevTools can be moved to rearrange according to the user’s needs. We can dock the DevTools to the bottom, right, left, or into a separate window. The user can also change the DevTools theme in the setting option present in the three dots in the top right corner of the DevTools.
- Feels Responsive to Use: The DevTools feels responsive to use and takes little to no time to display information. As it is built into the browser there are no lags and the UI response is instant.
How to Open DevTools in Microsoft Edge:
We have multiple ways to open DevTools. These are:
- Using Shortcut Keys: In Edge visit the webpage where you want to use the Developers tool and then press the shortcut keys “Ctrl+Shift+I” or F12.
- Using Settings menu: In Edge in the top-right corner there is a button with three horizontal dots click it. A menu appears from that menu navigate to More tools > Developers tools.
- Using right-click context menu: In Edge visit the webpage right-click anywhere on the page and then select inspect from the context menu that appears.
Opening DevTools in Edge
About the UI of DevTools:
The UI of the DevTools is separated into two main sections. The top section contains the main toolbar tabs and a bottom toggle window called drawer contains the drawer toolbars tab. Every tool in DevTools has its own tab so, for example, you can call the Welcome tool in DevTools a Welcome Tab.
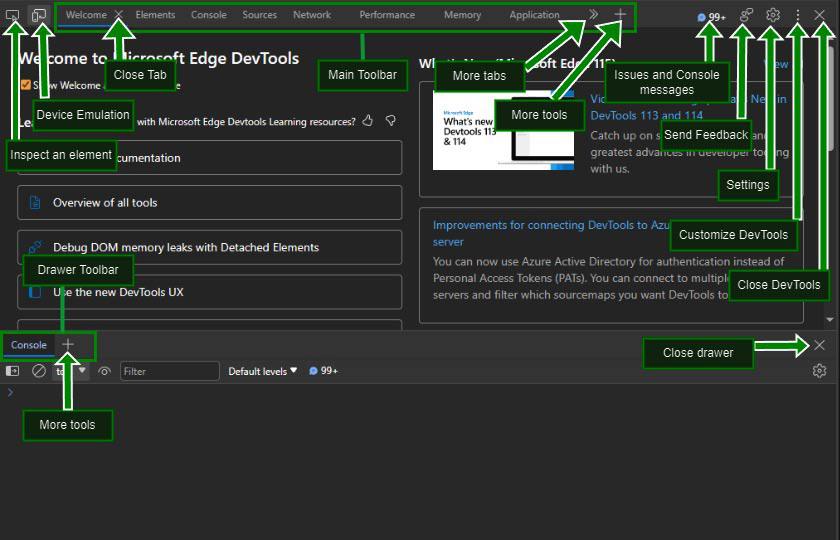
UI of DevTools
1. Main Section:
- Inspect an element: This option is used to select a particular element in the webpage to be displayed in the HTML code in the Elements Tab. The option is very handy as it saves time by searching the whole HTML code for a particular element.
Inspecting Elements
- Device Emulation: This option is basically used to check the webpage for responsiveness and other device-related conditions. On clicking the option it displays the webpage with various device-related options such as device width and height, rotation, zoom level, network throttling, etc.
Emulation various Device contitions
- Close Tab: This cross symbol appears in the selected tab and is used to close the selected tab. The Elements, Console, and Sources tab are the default DevTools tab and cannot be closed so the cross symbol does not appear when these tabs are selected.
Closing Multiple tabs
- Main Toolbar: All the tabs for respective tools in the main window are arranged together in the series and newly added tools become part of this toolbar.

Main Toolbar
- More tabs: The no. of tools added as a tab in the toolbar may exceed the required width of the toolbar so, these tabs are separated under the More tabs option. On clicking this double greater-than button it will display the list of tabs that overflowed from the toolbar.
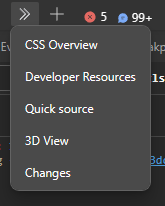
More tabs List
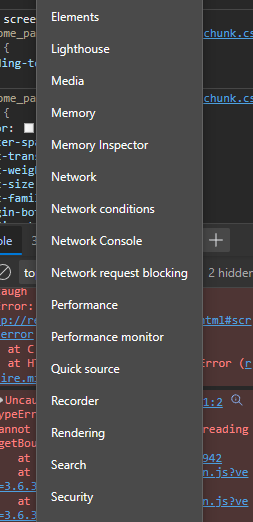
- More tools: All the tools that are not part of the toolbar can be selected from the More tools option. On clicking this add button you will get the list of all the tools that the DevTools provide but are not part of the toolbar.
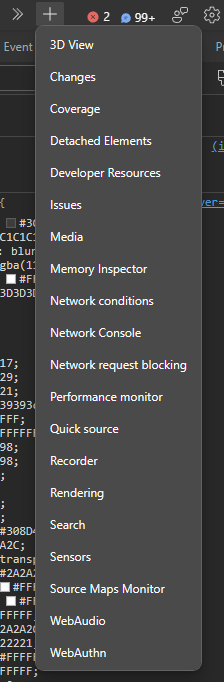
More tabs list
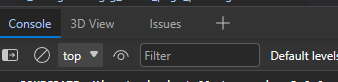
- Issues and Console Messages: The DevTools also provide the no. of console errors, warnings, and issues on the webpage. On clicking the console errors or warnings count you are brought to the console tab and on clicking the issues count you are brought to the issues tab.
Issues and Console Messages
- Send Feedback: This option opens a window asking for feedback about the DevTools. The window asks for your email address, the URL of the page where the DevTools is being used, an input field describing the problem or feedback, and many other things.
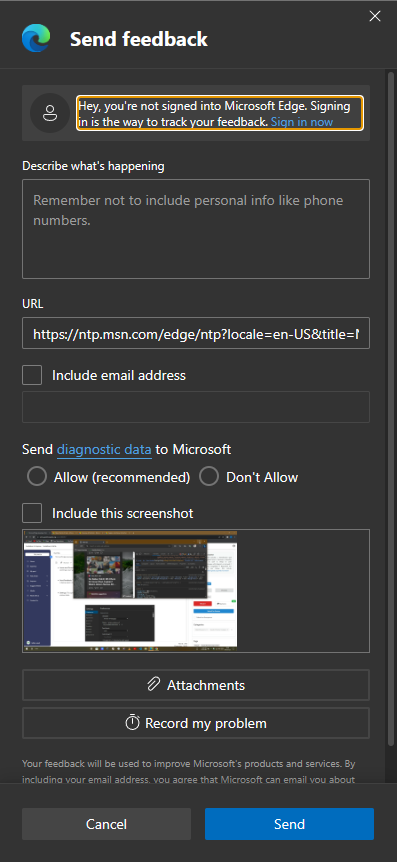
Send Feedback Window
- Settings: This option takes us to the setting window which contains various options to customize the DevTools. You can enable/disable features and add your own custom data in various tools. All the Settings are in categories under different panes such as Preferences, Workspace, Shortcuts, etc.
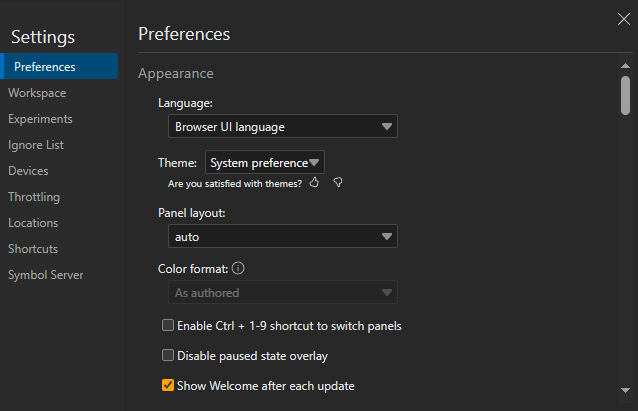
DevTools Settings
- Customize DevTools: This button provides a menu containing various options to change the dock position of the DevTools and also various commonly used options such as run command, open file, device emulator, etc.
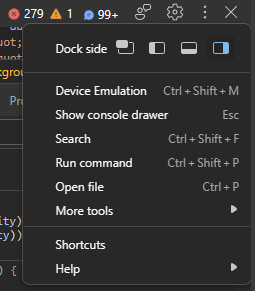
Various options in Customize DevTools menu
- Close DevTools: This cross button present in the top-right of the main section is used to close the whole DevTools sub-window.
Closing DevTools
2. Drawer Section:
- Drawer Toolbar: All tools provided by DevTools can also be present in the drawer section as a tab in the drawer toolbar. Except for console tab, you can’t have the tool tab present both in the main toolbar and drawer toolbar.
Drawer Toolbar
- More tools: This add button provides the list of all the tools provided by the DevTools but are not part of the drawer toolbar.
Drawer More tools
- Close drawer: This cross button is used to close the drawer in case you don’t need it. To bring back the drawer just press the ESC button on your keyboard or in the Customize DevTools menu select “Show console drawer”.
Closing and Opening Drawer
Customizing the DevTools:
There are many things in DevTools that can be customized according to your needs. Some of them are:
1. Reset DevTools:
You can restore the tabs and settings of DevTools back to default using the button called “Restore defaults and refresh” preset in the Preference pane in the DevTools settings.
Reset DevTools
2. Change the Theme of DevTools:
You can change the theme in the DevTools setting or by using Run Command.
- Using Run Command: To change the theme using Run Command, press the shortcut key “Ctrl+Shift+P” or select Run Command from Customize DevTools and then type theme. Select any theme you want from the list of options that appear.
Changing theme using Run Command
- Using DevTools Setting: To change the theme using DevTools Setting, click the setting button on the top-right part of the DevTools. Under the Preferences pane select the ones you want from the Theme drop-down list. The list is categorized into 3 sections which are the System preference, Light themes, and Dark themes.
Changing theme using DevTools Setting
3. Change the Language of DevTools:
You can change the language of DevTools in the DevTools Setting under the Preferences Pane. In Preferences Pane select the language you want from the Language drop-down list.
Changing Language of DevTools
4. Change the Dock Position of DevTools:
The DevTools dock position can be changed to the left, bottom, or right part of the Browser. You can also have the DevTools in a Separate window.
Changing Dock Position
5. Toggling Tooltips in DevTools:
To get to know about the tools and the panes in each tab of the tools in DevTools you can turn on Tooltips. The Tooltips can be toggle from the Help option present in the Customize DevTools button i.e. the three dots present in the top-right part of DevTools.
Toggling Tooltips
6. Zoom in and out in DevTools:
You can zoom the DevTools by holding “Ctrl” and then pressing “+” to zoom in, “-” to zoom out and “0” to reset zoom. You must first focus on the DevTools to do that just click anywhere in the DevTools. The zoom will only affect the DevTools and not the webpage.
Pressing Ctrl and + to zoom in, Ctrl and – to zoom out, Ctrl and 0 to reset zoom
7. Arrange tabs in DevTools:
You can move tabs between main toolbar and drawer toolbar by just right clicking the tab and select Move to top or Move to bottom respectively. You can also change the arrangement of the tabs in the main or drawer toolbar by dragging the tab to the required position.
Arranging a tab in DevTools
How to Add More Tools in DevTools:
There are multiple ways to add tools in the main toolbar which are:
1. Using Add icon:
The DevTools by-default have some tools tab present in the toolbar to add other tools press the add icon which present after the last tab in the toolbar and the select the required tool from the list of options.
Locating Tools using Add icon
2. Using Run Command:
The DevTools also provides you a run command search menu where you can search the tool name and the options appears in the format Show <tool-name>. To turn on DevTools Run Command use the shortcut key “Ctrl+Shift+P”.
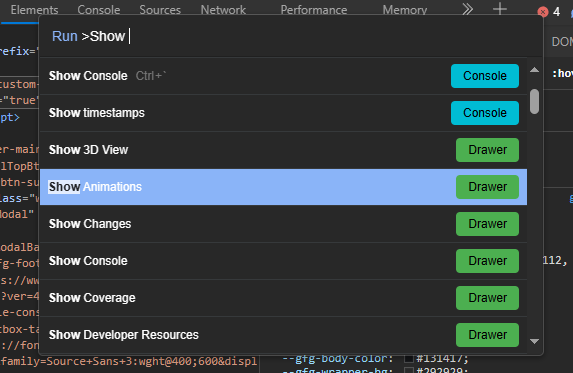
Locating Tools using Run Command
3. Using More tools option:
In the top-right corner of the DevTools you have three dots. Click the three dots then select More tools from the menu that appears. On selecting More tools you get the list of all the tools click the one which you want to use.
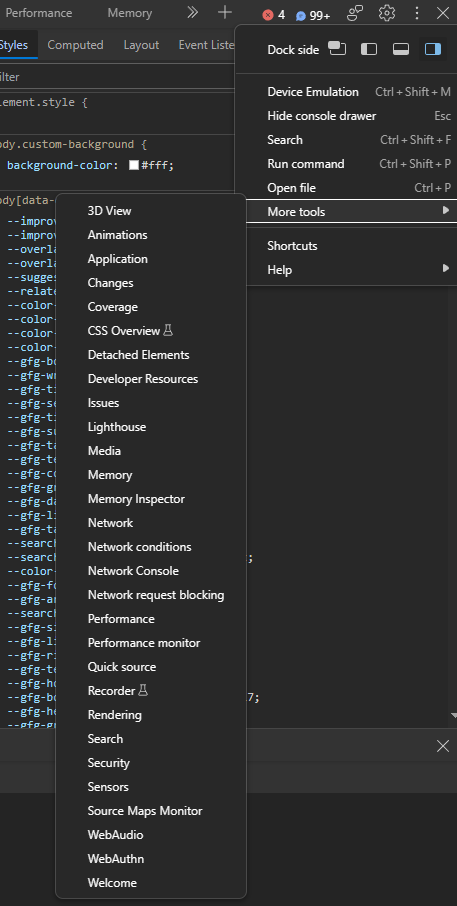
Locating Tools using More tools menu
About all the core DevTools in Edge:
There are many tools and options provided in the DevTools in Edge that allow developers to debug, test, and check for the performance of their website. All the core tools are:
1. Welcome:
The first time you open DevTools after installing Edge or after updating it, this Welcome tab is displayed. The tab displays the latest updated information and also the links to documentation for using the DevTools.
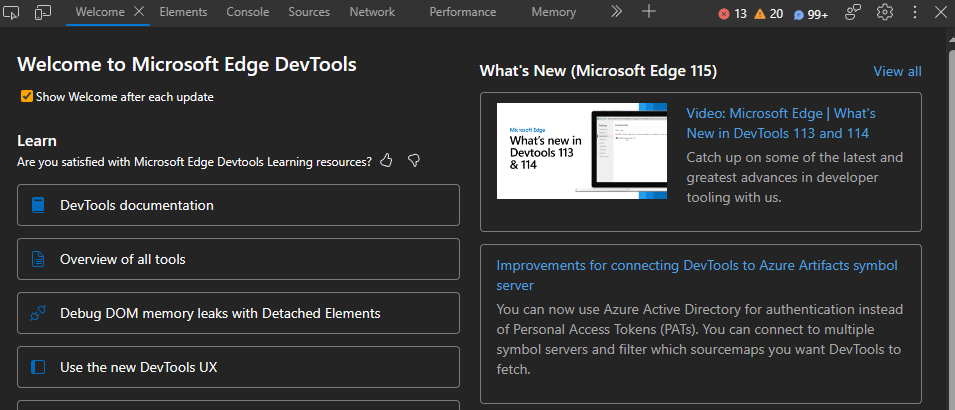
Welcome Tool
2. Elements:
Provides the DOM view where you can inspect the HTML and CSS code of the webpage and debug them accordingly. You can also edit CSS code and check the changes live in the browser itself.
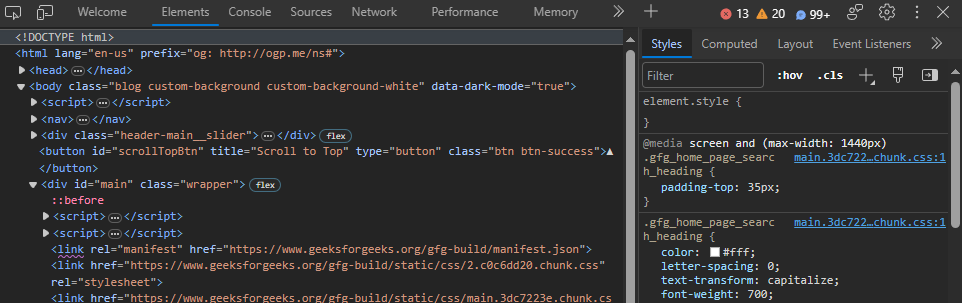
Elements Tool
3. Console:
It is used to display various messages, errors, or warnings on the webpage and also allows users to write JS code which can be used to get information or manipulate the webpage.
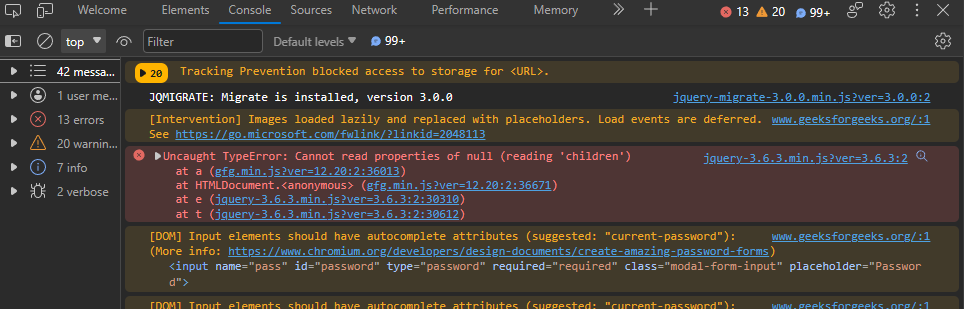
Console Tool
4. Sources:
The tab works as an editor to edit the HTML, CSS and JS files of the webpage. You can also debug the code using breakpoints and various options with respect to breakpoints.
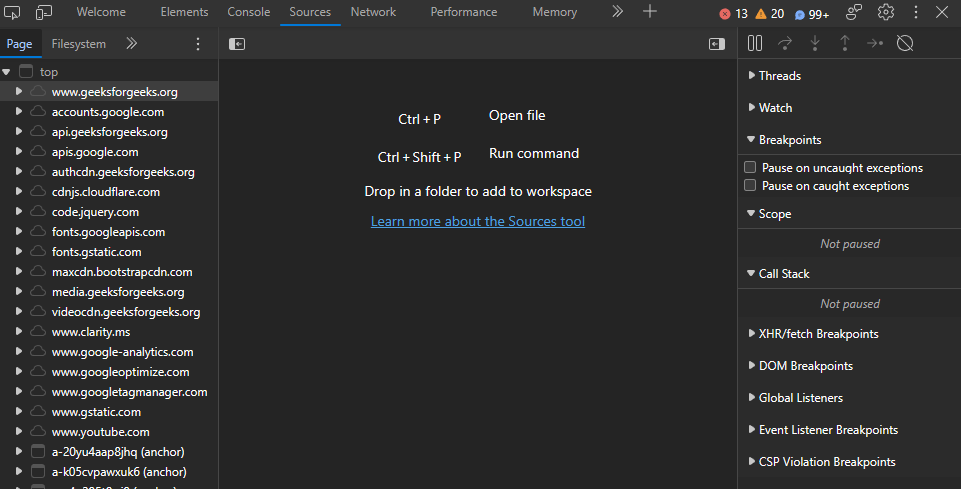
Sources Tool
5. Network:
It is used to view network requests and various resource information that are being downloaded or uploaded by the webpage. You get various information about the resources such as type, size, and HTTP response status codes.
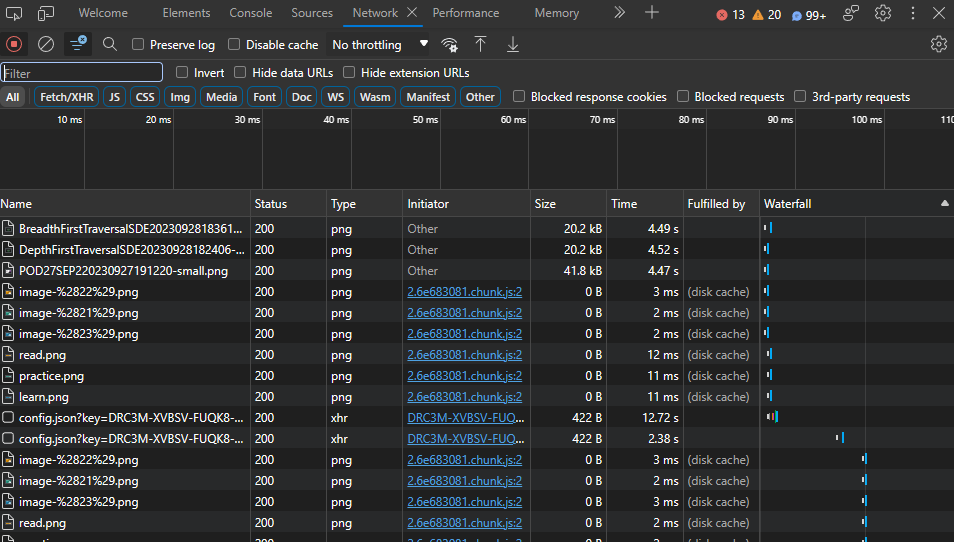
Network Tool
6. Performance:
It is used to view the performance of the webpage after it is fully loaded. You can check for various memory and CPU usage of the webpage. The tool provides various views such as tables and graphs to analyze the performance of the webpage.
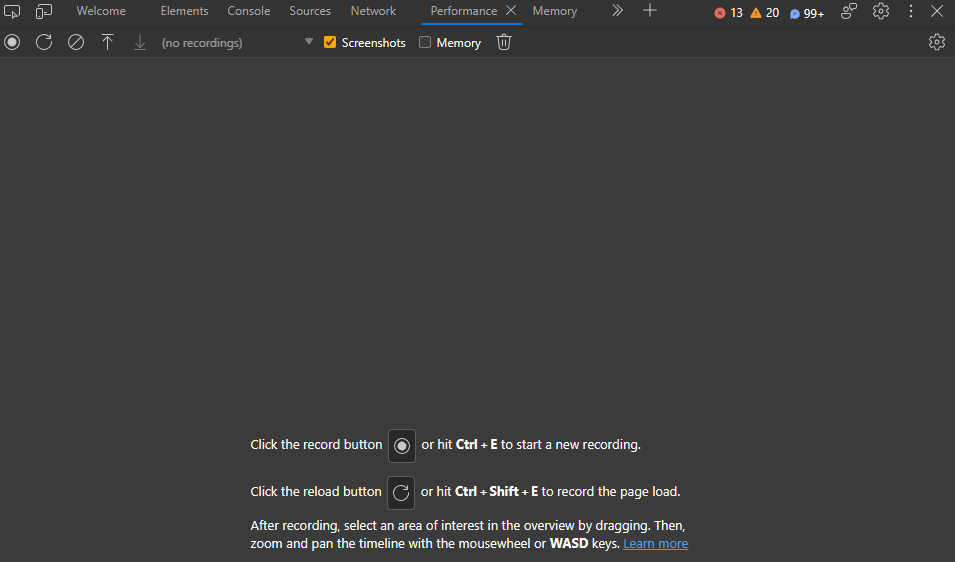
Performance Tool
7. Memory:
It is used to check the memory usage of the webpage and find potential memory leaks. The memory that is not garbage collected can be viewed and debugged using this tool.
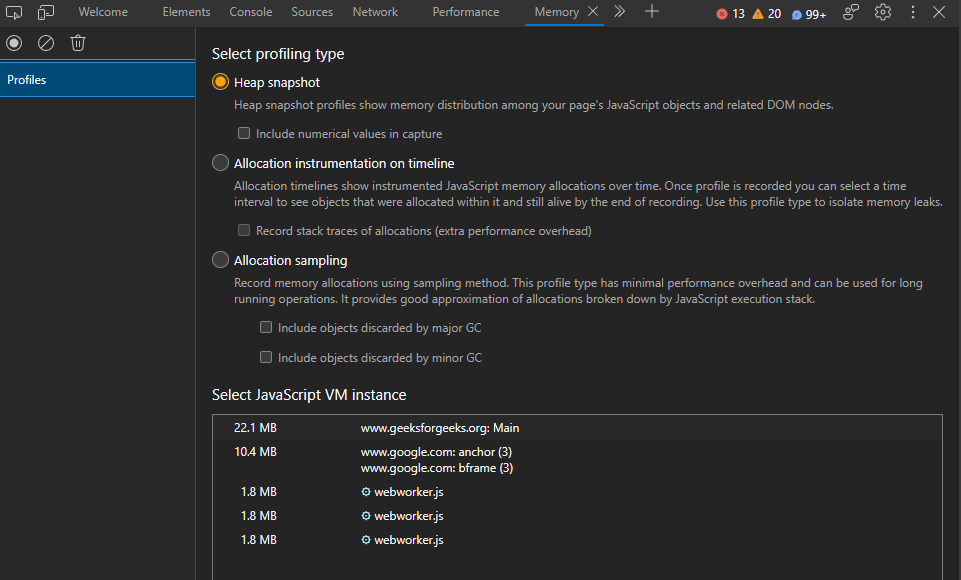
Memory Tool
8.Application:
The tools is used to view and manage storage, background services, and other web app-related information on the webpage. You can view and edit the storage and analyze your site for various background processes.
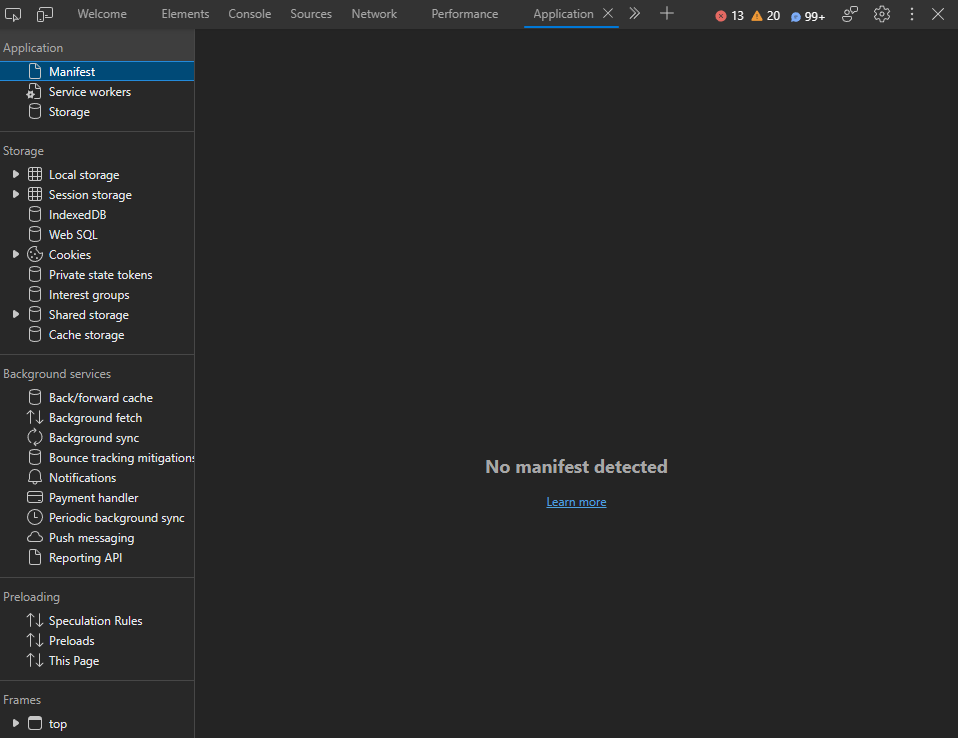
Application Tool
9. Security:
The tools check the security of the webpage that its running valid HTTPS. It also provides certificate and encryption and authentication details of the various resources origin used by the webpage.
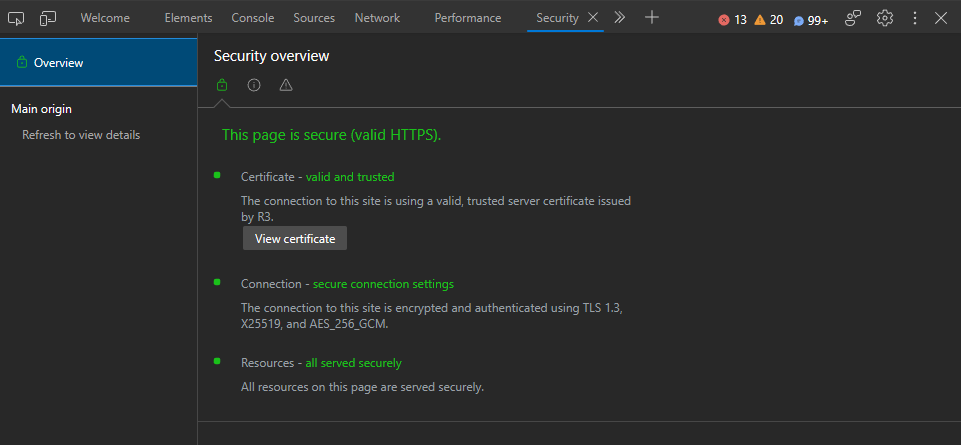
Security Tool
10. Lighthouse:
It is used to check the webpage for user experience, accessibility, performance, SEO, and various other parameters and provides ratings and solutions to these problems. This tool is used after developing a working site to test the site and get better ratings.
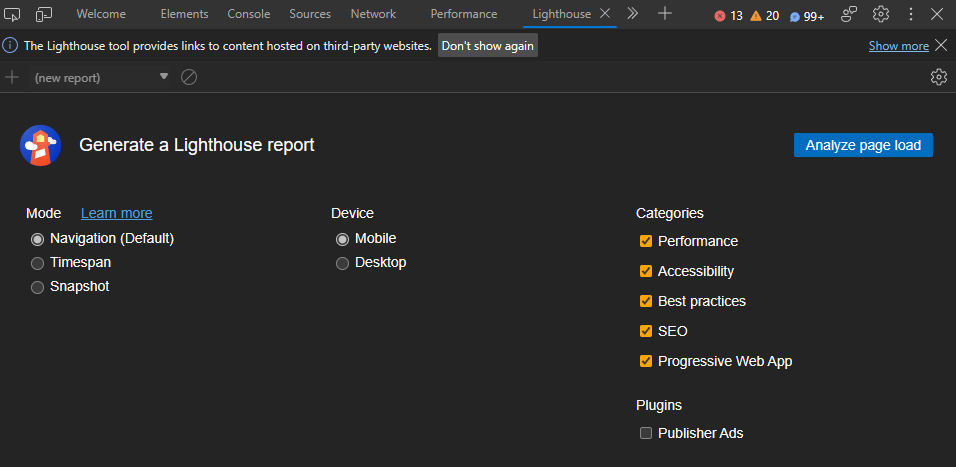
Lighthouse Tool
11. CSS Overview:
Provide an overview of the colors, fonts, media queries, and other CSS information used in the sites. Used to get quick information about the CSS code used in the webpage and check for problems.
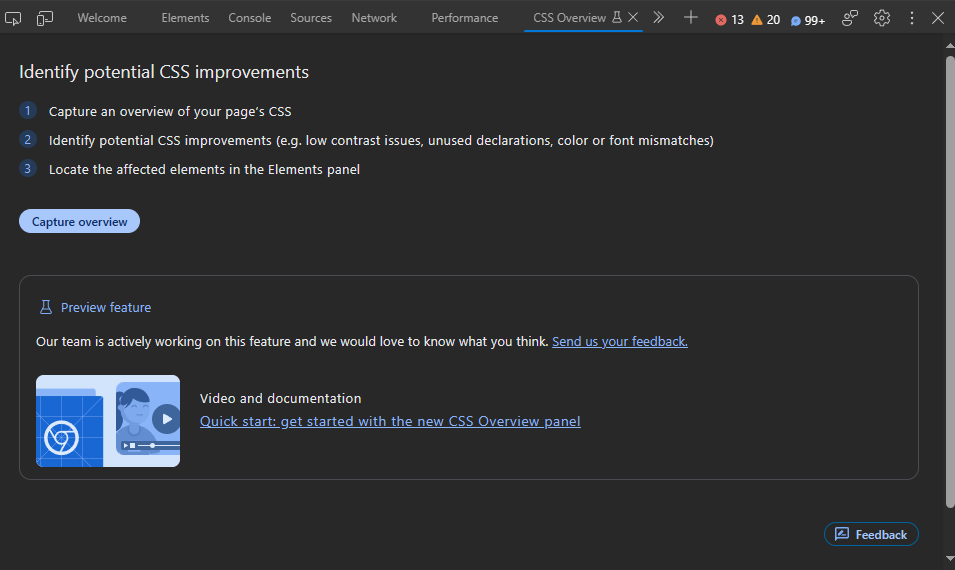
CSS Overview Tool
12. 3D View:
It provides a 3D view of the webpage with respect to the DOM, z-index, and various layers of the webpage. This is used to get a good look into how layers are arranged and the stacking context of the webpage.
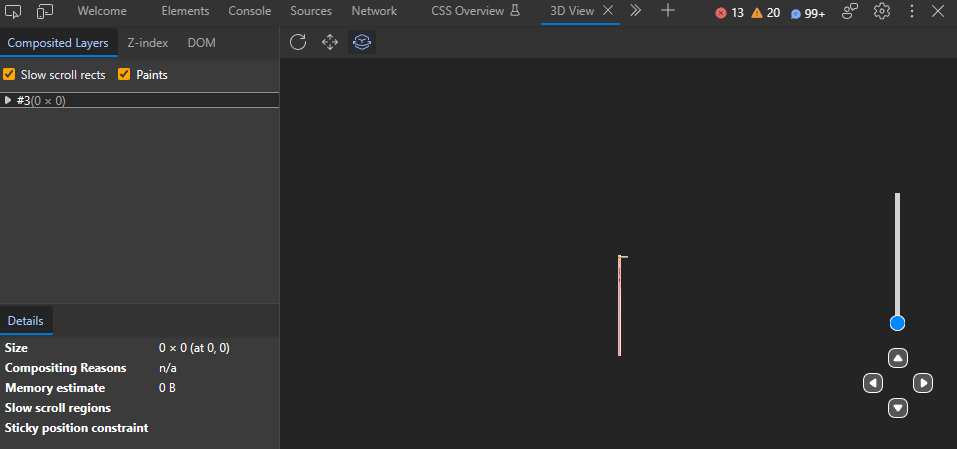
3D View
13. Animations:
Provides information about all the animations of the webpage and also allows to make modifications to these selected animations. The modification can be done to the animation duration, delay, and keyframe timings.
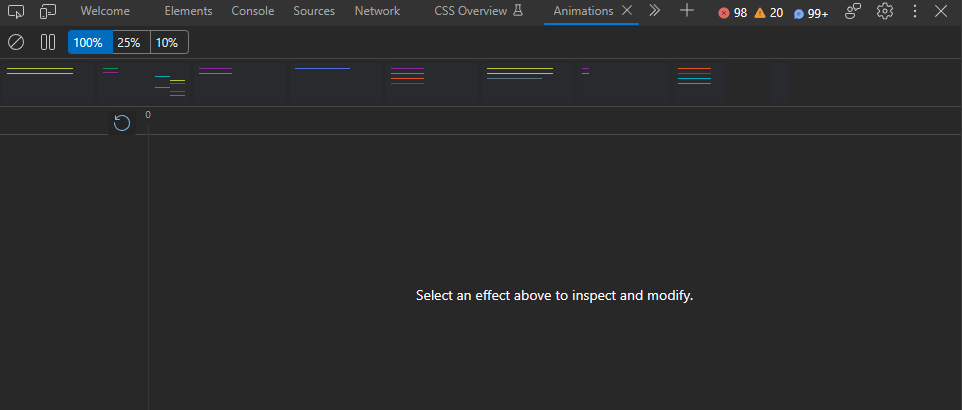
Animations Tool
14. Changes:
It displays the changes made to the CSS and JS files while using DevTools. It is color-coded showing the inserted lines in green and deleted lines in red. Developers can use the tool to get information about all the changes to be made in the actual source code.
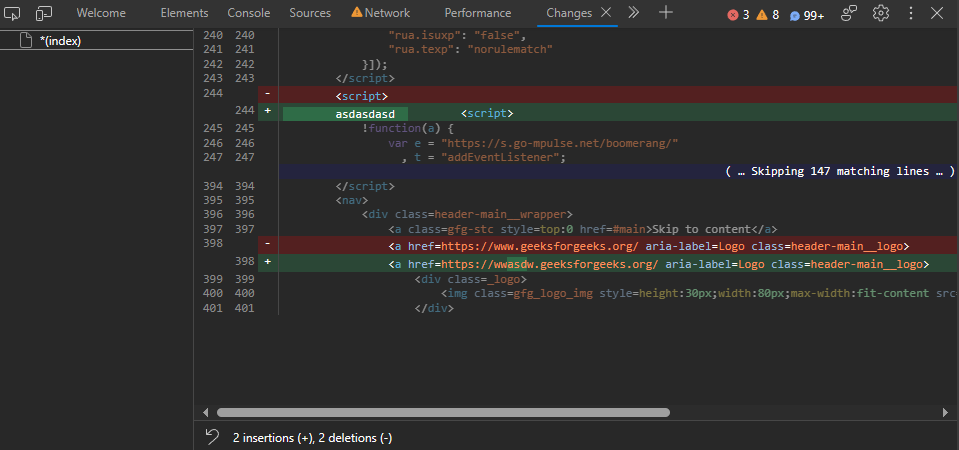
Changes Tool
15. Coverage:
It is used to find unused CSS and JS files that are loaded for the webpage but are not used. This is done to increase the loading time of the webpage by minimizing the useless code that is loaded by the webpage.
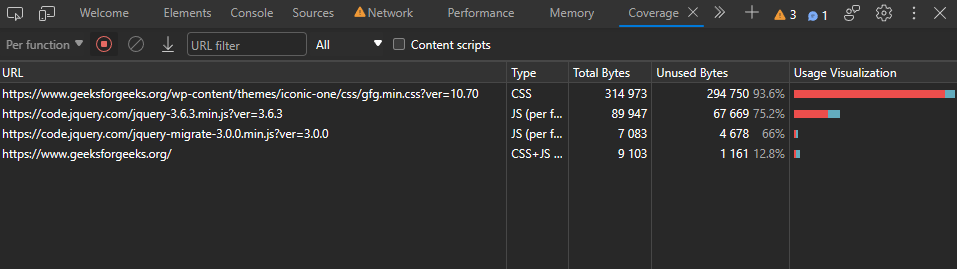
Coverage Tool
16. Detached Elements:
It is used to find JS objects that are referencing detached elements. The tool is used to check for potential memory leaks due to detached elements that are not properly garbage collected by the browser.
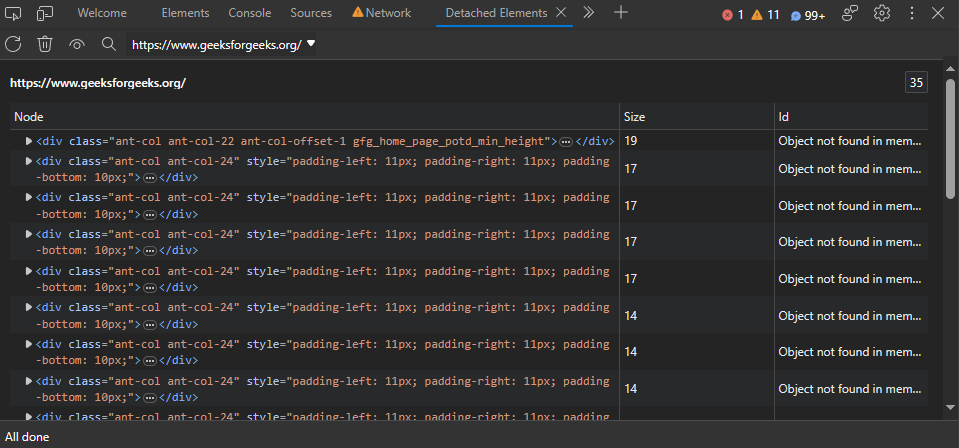
Detached Elements
18. Developer Resources:
The webpage may use various resources these resources are requested using their URLs to get the list of all resources URLs this tool can be used. It gives us the idea of various resources that are being used by the webpage and the size of each resource give developers the information to deal with the loading time and memory consumption of the webpage.
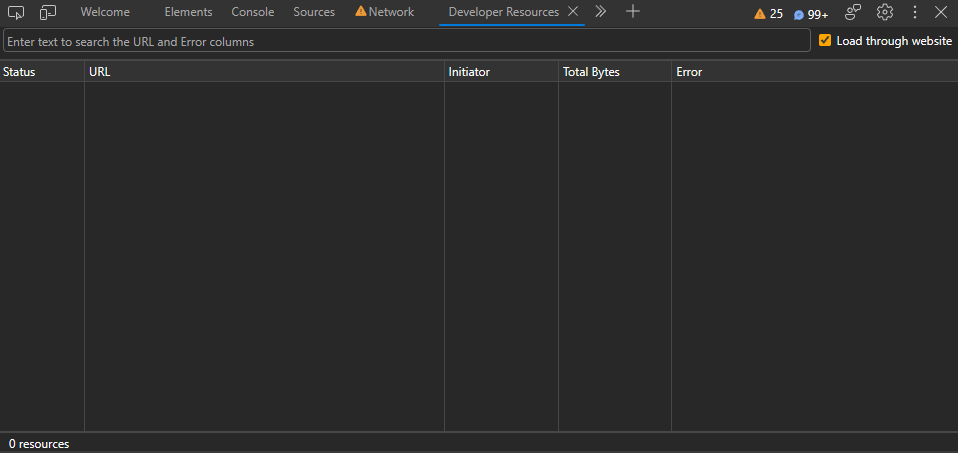
Developer Resources
19. Issues:
The tools provided a list of issues with respect to accessibility, compatibility, PWA, etc., and also provided documentation for further reading about the issues. The tools are very helpful as they showcase all possible issues that may have gone unchecked during development and the provided reference links also saves a lot of time in searching for the problem.
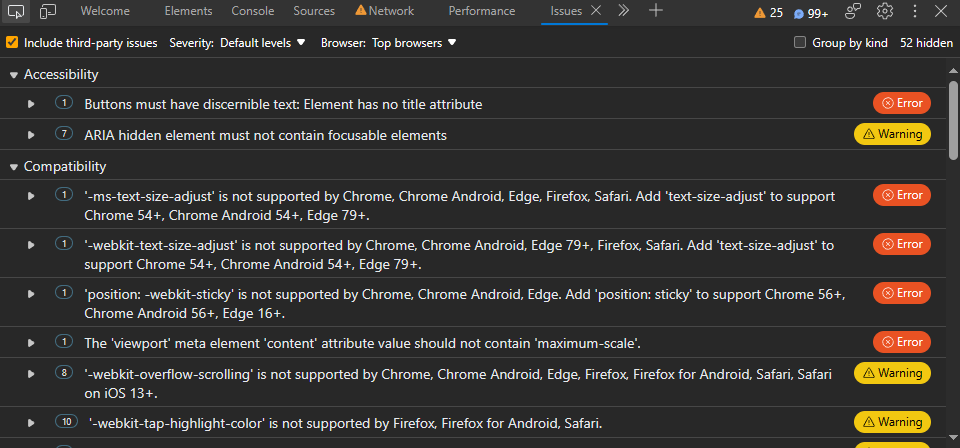
Issues Tool
20. Media:
The various video and audio players used in a webpage in displayed in this tab. You also get information such as the audio and video decoder which can be used for debugging purposes. The tools provide the list of all the media players on the webpage so, at once you can get the information of all the media players on the site.
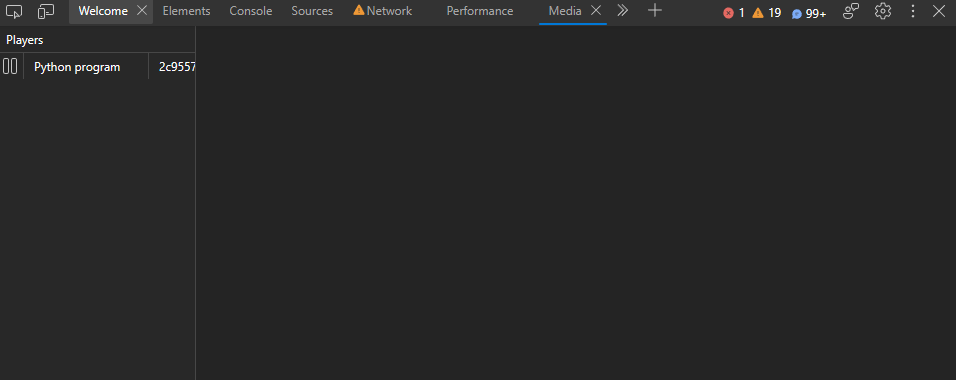
Media Tool
21. Memory Inspector:
The tool is used to view different memory objects and ASCII directly. The tool also allows you to select the type of endian and also allow you to toggle the different values that are being displayed. The tool is helpful if you want to check the array buffer values and their corresponding ASCII representation.
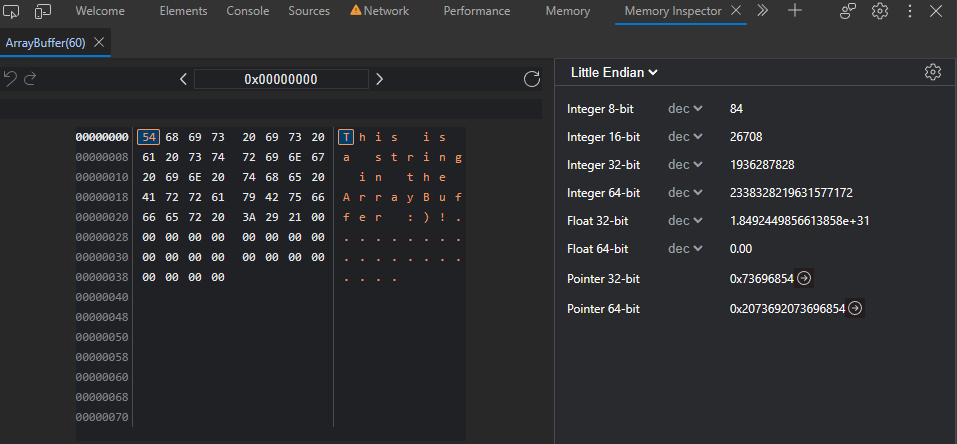
Memory Inspector
22. Network conditions:
It is used to manipulate various network-related options such as disabling the browser cache, setting network throttling and user agent, etc. The tools are used to test the webpage for different network conditions which happens when a wide range of users with a variety of network conditions visit the site.
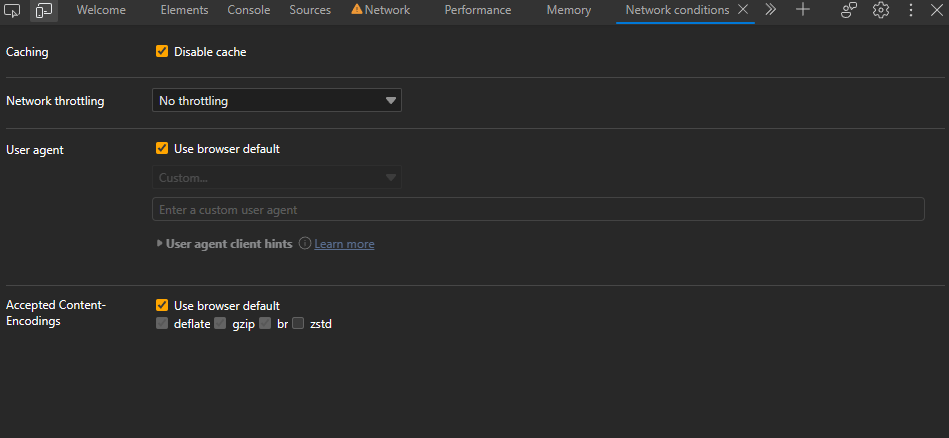
Network Conditions Tool
23. Network Console:
It is used to send web API requests and check for various problems. You can change and replay any of the network requests to test the webpage for API calls. The tool allows many REST methods such as GET, HEAD, POST, PUT, and PATCH.
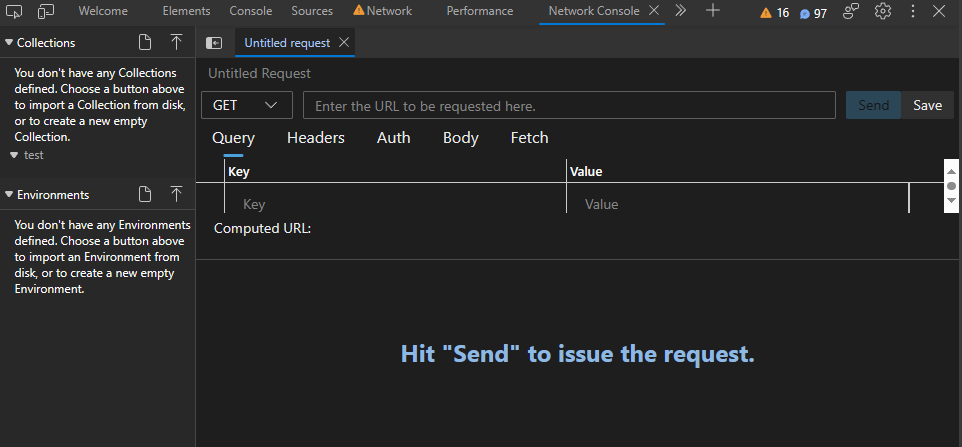
Network Console Tool
24. Network request blocking:
It is used to block network requests of the webpage which can be used to test the webpage behavior when the requested resources are not fulfilled. This comes in handy when we want to make our site dynamic and error-prone.
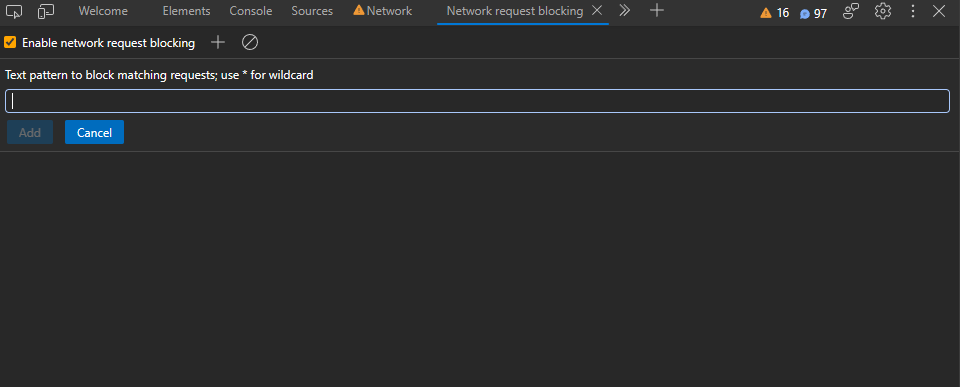
Network Request Blocking Tool
25. Performance Monitor:
It is used to get the real-time performance of the webpage. The tools give us real-time information about CPU usage, memory usage, event listeners, etc. which can be used to check and improve the site performance.
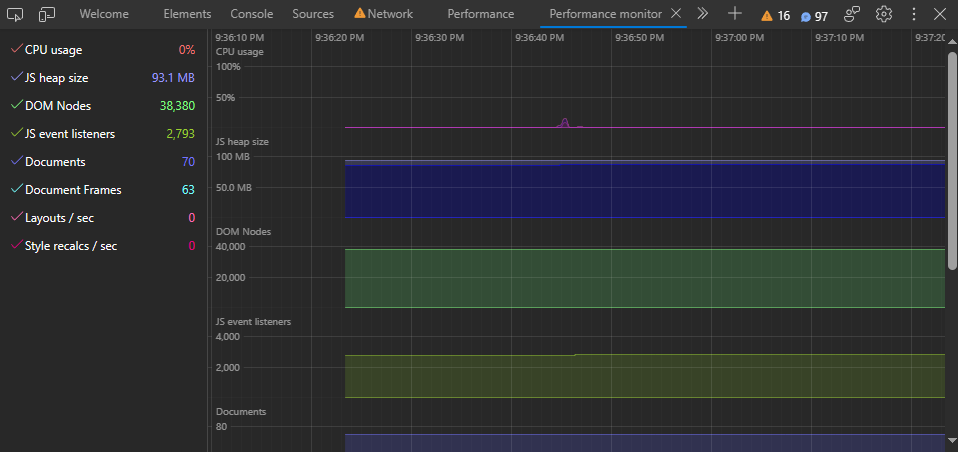
Performance monitor Tool
26. Quick Source:
It tools is used as an alternative to the Sources tool. When you are using other DevTools and need to frequently visit the Sources Tool then you can use the Quick Sources tool in the Drawer of the DevTools.
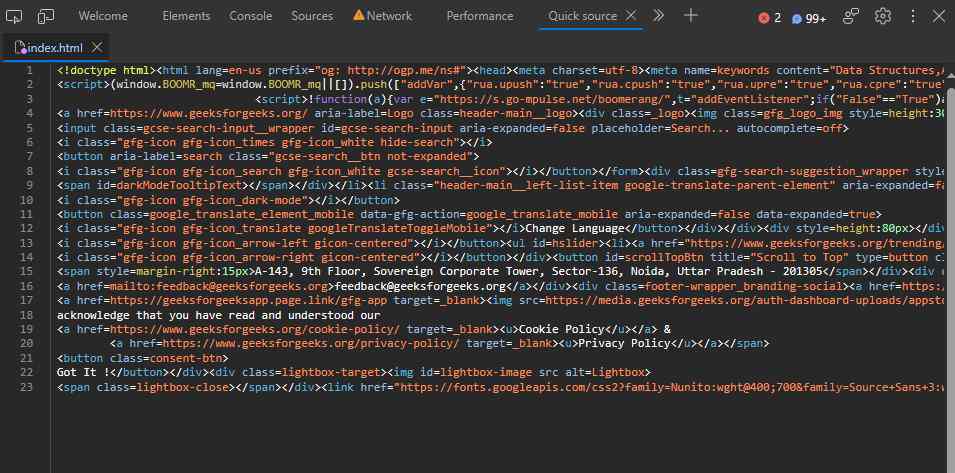
Quick Source Tool
27. Recorder:
It is used to record the user’s steps across the various pages visited to get an idea of the flow of the web app. The developers can ask the user or they themselves can start this tool and navigate around the whole site to get the performance of the website as a whole.
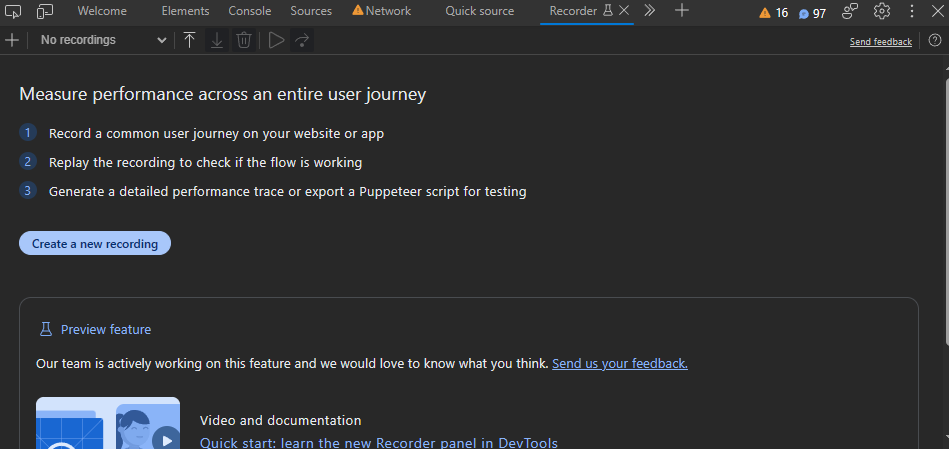
Recorder Tool
28. Rendering:
The tool provides various options to check for different display and vision options. There are multiple options that can help to highlight different problems in the webpage mainly related to the layout and visuals.
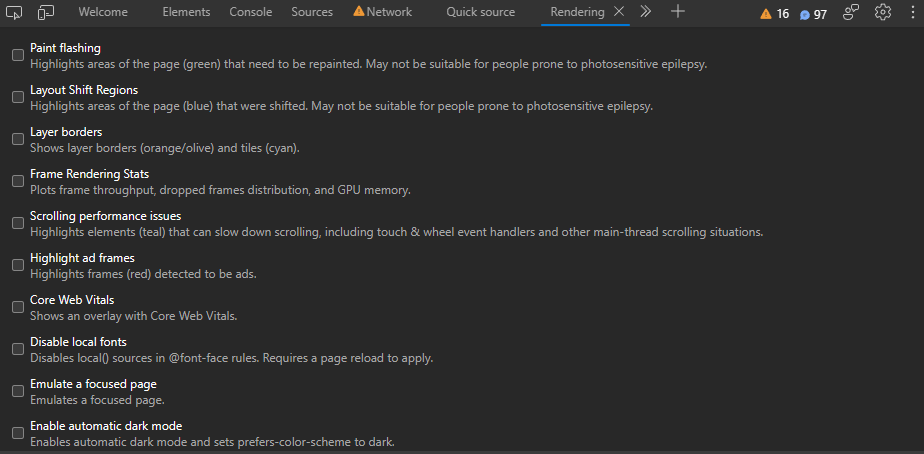
Rendering Tool
29. Search:
It is used to search patterns in various source files of the webpage such as HTML, CSS, JavaScript, and image files. This is a handy tool to search the whole codebase of the webpage for debugging or viewing purposes.
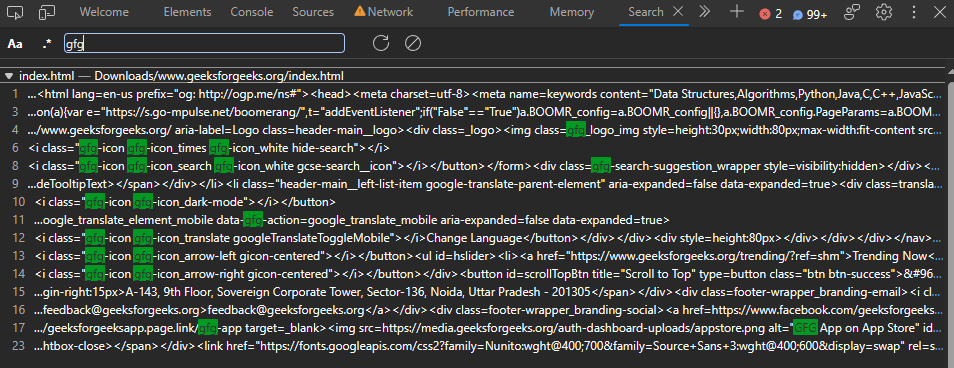
Search Tool
30. Sensors
It is used to simulate device location, orientation, touch, and state to test and debug this webpage which uses various sensors of the devices. Nowadays webpage are designed to use multiple sensors in the webpage.
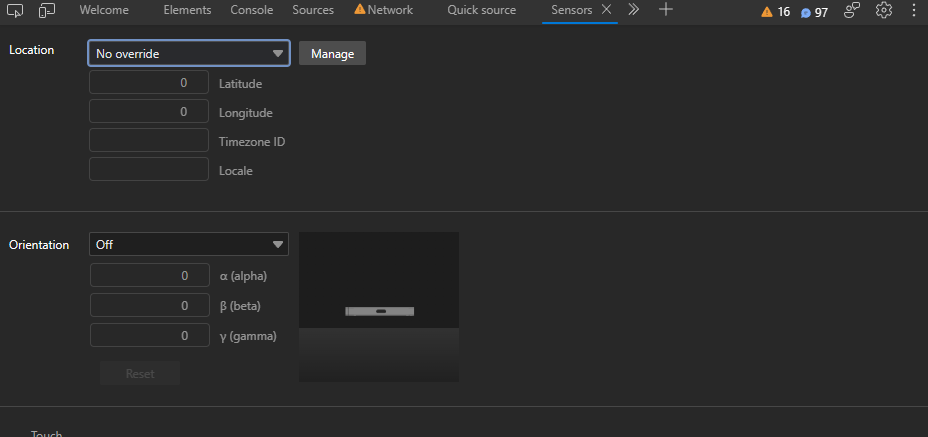
Sensors Tool
31. Source Maps Monitor
The tool is used to monitor the source maps that are requested by the source files of the webpage. These source maps are used to get the original JS code which may be changed by the server for various reasons.
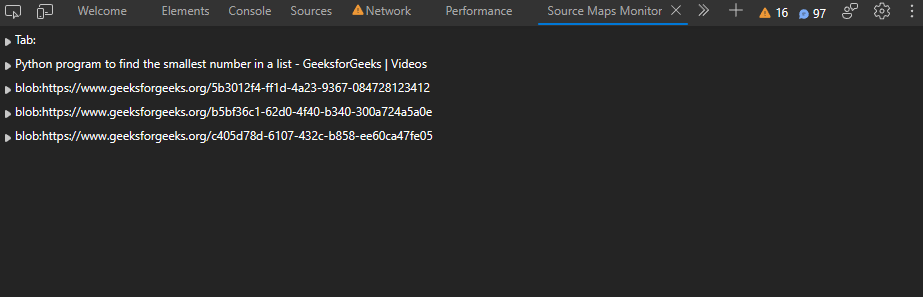
Source Maps Monitor Tool
32. WebAudio
It is used to monitor the graph of WebAudio nodes of the WebAudio API used by the webpage. Developers using WebAudio API can use it to get information for debugging the webpage.
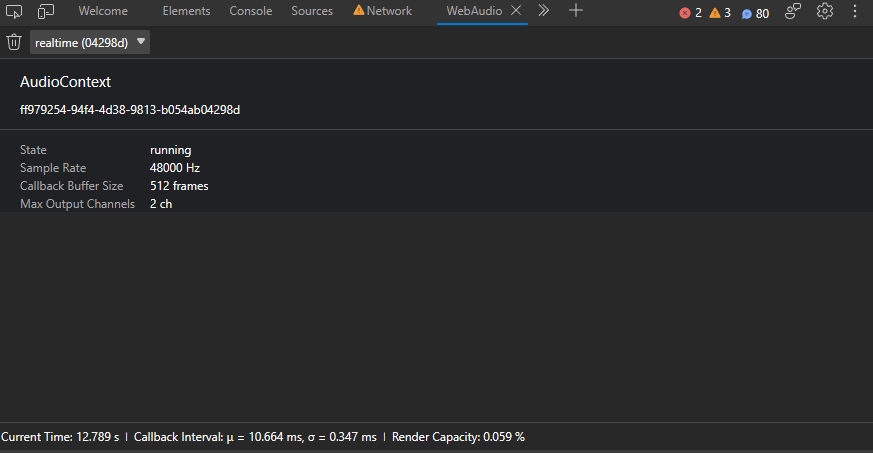
WebAudio Tool
33. WebAuthn
It is used to emulate software-based virtual authenticators and debug the Web Authentication API. Developers who want to check the Web Authentication API used in their webpage can use this tool.
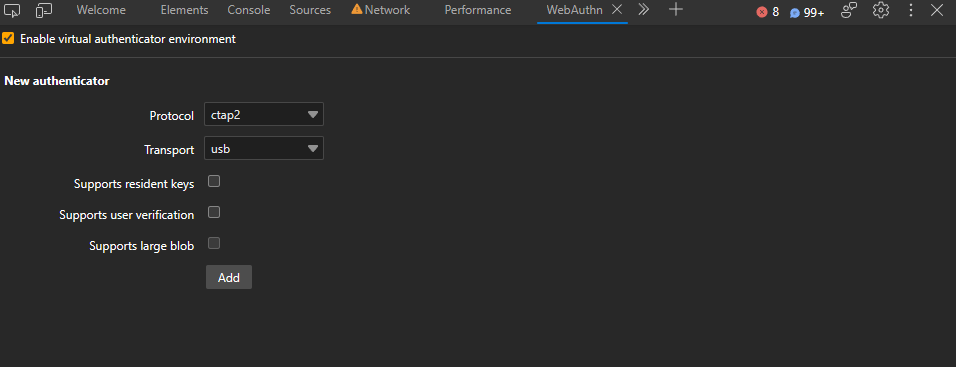
WebAuthn
Conclusion
A webpage can have many problems to tackle and debug by the developers. DevTools in Edge comes as a savior it provides various tools with respect to the webpage styles, JavaScript, performance, and many other aspects. These tools have lower learning curves and developers also have options to customize the DevTools window.
Share your thoughts in the comments
Please Login to comment...