Vehicle Count Prediction From Sensor Data
Last Updated :
12 Oct, 2021
Prerequisite: Regression and Classification | Supervised Machine Learning
Sensors which are placed in road junctions collect the data of no of vehicles at different junctions and gives data to the transport manager. Now our task is to predict the total no of vehicles based on sensor data.
This article explains how to deal with sensor data given with a timestamp and predict the count of the vehicle at a particular time,
Data Set Description:
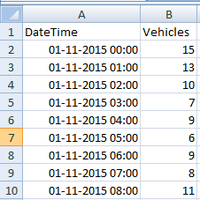
This dataset contains 2 attributes. They are Datetime and Vehicles. Where Vehicles is the class label.
Link for download this data – click here

The class label is of numeric type. So the regression technique is well suited for this problem. Regression is used to map the data into a predefined function it is a supervised learning algorithm that is used to predict the value based on historical data. We can perform regression on our data if the data is numeric. Here class label Ie Vehicles attribute is the class label which is numeric so regression should be done.
Random Forest Regressor is an ensemble technique that takes the input and builds trees then takes the mean value of all trees per row/per tuple.
Syntax: RandomForestRegressor(n_estimators=100, *, criterion=’mse’, max_depth=None, min_samples_split=2, min_samples_leaf=1, min_weight_fraction_leaf=0.0, max_features=’auto’, max_leaf_nodes=None,min_impurity_decrease=0.0, min_impurity_split=None, bootstrap=True, oob_score=False, n_jobs=None,random_state=None, verbose=0, warm_start=False, ccp_alpha=0.0, max_samples=None)
Approach:
- Import necessary modules
- Load the dataset
- Analyze the data
- Convert DateTime attribute to week, days, hours, month, etc (which is in timestamp format.)
- Build the model
- Train the model
- Test the data
- Predict the results
Step 1: Importing the pandas module for loading the data frame.
Python3
import pandas as pd
train = pd.read_csv('vehicles.csv')
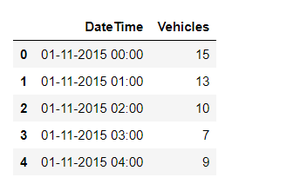
train.head()
|
Output:

Step 2: Define the functions for getting month, day, hours from the Timestamp (DateTime) and load it into different columns.
Python3
def get_dom(dt):
return dt.day
def get_weekday(dt):
return dt.weekday()
def get_hour(dt):
return dt.hour
def get_year(dt):
return dt.year
def get_month(dt):
return dt.month
def get_dayofyear(dt):
return dt.dayofyear
def get_weekofyear(dt):
return dt.weekofyear
train['DateTime'] = train['DateTime'].map(pd.to_datetime)
train['date'] = train['DateTime'].map(get_dom)
train['weekday'] = train['DateTime'].map(get_weekday)
train['hour'] = train['DateTime'].map(get_hour)
train['month'] = train['DateTime'].map(get_month)
train['year'] = train['DateTime'].map(get_year)
train['dayofyear'] = train['DateTime'].map(get_dayofyear)
train['weekofyear'] = train['DateTime'].map(get_weekofyear)
train.head()
|
Output:

Step 3: Separate the class label and store into the target variable
Python3
train = train.drop(['DateTime'], axis=1)
train1 = train.drop(['Vehicles'], axis=1)
target = train['Vehicles']
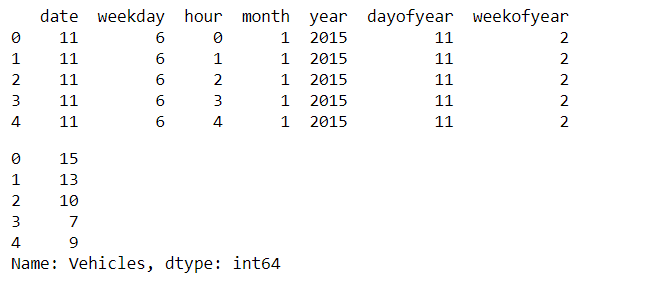
print(train1.head())
target.head()
|
Output:

Step 4: Create and train the data using Machine Learning algorithms and predict the results after testing.
Python3
from sklearn.ensemble import RandomForestRegressor
m1=RandomForestRegressor()
m1.fit(train1,target)
m1.predict([[11,6,0,1,2015,11,2]])
|
Output:
array([9.88021429])
Share your thoughts in the comments
Please Login to comment...