The Robustbase package in R programming is a collection of functions and methods that are widely used and was designed to do robust statistics. The Robustbase package provides tools for Robust Regression, Multivariate Analysis, and Outlier Detection.
Robust Statistics:
It is a branch of statistics that aims to provide methods that are more resistant to non-normal data compared to traditional statistics.
Robust Regression:
It is a sort of regression analysis that is less sensitive to outliers than standard regression approaches. The Robustbase package includes robust regression functions such as the MM-estimator, S-estimator, and LMS-estimator.
Multivariate Analysis:
The Robustbase package includes robust multivariate analysis utilities. These methods are useful and are widely used when studying datasets with numerous variables because outliers or non-normal data in one variable might have a large impact on the overall analysis.
Outlier Detection:
The Robustbase package includes outlier detection tools which are really helpful that can help find exceptional observations in a dataset that may be impacting the analysis’s conclusions.
Installation of Robustbase Package in R
To use the Robustbase package in R, you first need to install it using the following command:
install.packages("robustbase")
Load the Robustbase package using the following command :
library(robustbase)
Now we can successfully use Robustbase tools in your R session for robust statistics.
Functions in Robustbase Package in R
The Robustbase package in R programming provides a number of functions that are used to perform statistics operations. A few of them are listed below:
| |
Method |
Description |
| 1) |
lmrob() |
Computes MM-type estimators for linear Regression |
| 2) |
covMcd() |
Computes robust location and scatter estimation via MCD |
| 3) |
colMedians() |
Computes the median of rows or columns for a matrix |
| 4) |
outlierStats() |
Computes robust regression outlier statistics |
| 5) |
sigma() |
Extracts standard deviation of errors for robust models |
| 6) |
lmrob.control() |
Tune parameters for lmrob() and auxiliaries |
| 7) |
weights.lmrob() |
Extracts robustness and model weights |
| 8) |
plot.mcd() |
Plots diagnostic plot formcd objects |
| 9) |
lmrob.lar() |
Computes least absolute residuals of L1 regression |
| 10) |
predict.lmrob() |
Predicts values for robust linear model |
| 11) |
ltsReg() |
Carries out least trimmed squares robust regression |
| 12) |
lmrob.S() |
Computes S-estimator for linear regression |
| 13) |
smoothWgt() |
Computes smooth weight functions |
| 14) |
lmrob.fit() |
Computes MM-type estimators for regression |
| 15) |
lmrob..M..fit() |
Computes M-estimators of regression by performing RWLS iterations |
| 16) |
plot.lmrob() |
Plots diagnostic plot for lmrob objects |
| 17) |
summary.lmrob() |
Summary methods for lmrob objects |
| 18) |
summary.mcd() |
Summary methods for mcd objects |
| 19) |
nlrob |
Computes robust fitting of non-linear regression |
| 20) |
plot.lts() |
Plots diagnostic plot for lts objects |
| 21) |
rrcov.control() |
Controls settings for covMcd and ltsReg |
| 22) |
summary.lts() |
Summary method for lts objects |
| 23) |
summary.nlrob() |
Summary method for non-linear regression objects |
| 24) |
covComed() |
Computes the multivariate location and scatter estimator |
| 25) |
estimethod() |
Extracts the estimation method as a character string from a fitted model |
| 26) |
nlrob.control() |
Controls the non-linear robust regression algorithm |
| 27) |
Sn |
Computes robust scale estimator, an efficient alternative to the MAD |
Examples of Robustbase Package in R
Let us see a few examples of different functions and methods used in the Robustbase package in R.
Example 1: Robust regression using the MM-estimator using Robustbase Package in R
Syntax:
mmfit <- lmrob(stack.loss ~ ., data = stackloss, method = "MM",details = false)
Parameters:
- stackloss: It is a dataframe
- method: The method argument specifies the method to be used for the robust regression analysis. In this case, the “MM” method is used.
- details: If the detail is set to FALSE (the default), only the summary results are output but it can be used to control the amount of detail that is output during the regression analysis.
R
library(robustbase)
data(stackloss)
mmfit <- lmrob(stack.loss ~ ., data = stackloss, method = "MM")
summary(mmfit)
|
Output :
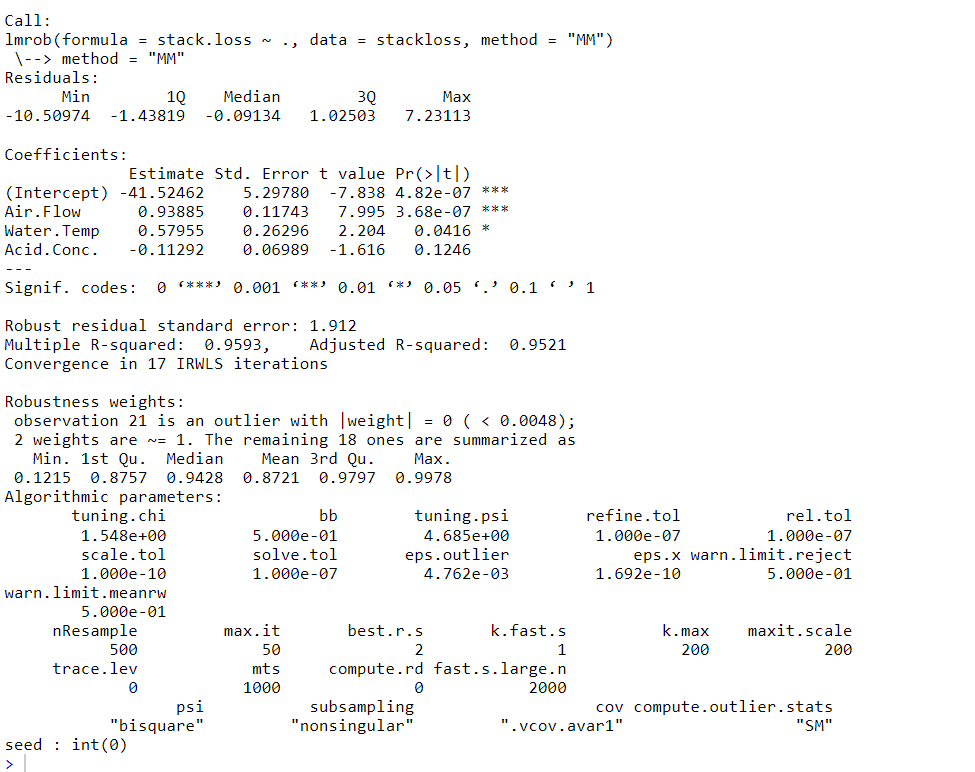
Robust regression using the MM-estimator
Example 2: Outlier Detection using the covMcd function of Robustbase Package in R
The covMcd() function from the Robustbase package detects outliers in the stackloss dataset. The outliers variable should contain the indices of the observations that are identified as outliers.
Syntax:
covMcd(x, center = NULL, alpha = 0.5, nsamp = NULL, maxit = 200, initial = "cov.1", ...)
Parameters:
- x: A numeric matrix or data frame of the data to be analyzed.
- center: By default, the center is set to NULL, which means that the center is estimated from the data.
- alpha: A numeric value between 0 and 1 specifying the subsample fraction to be used for estimating the covariance matrix. The default value is 0.5.
- maxit: An optional integer value specifying the maximum number of iterations to be used for the algorithm. The default value is 200.
- initial: A character string specifying the initial covariance estimate. The options are “cov.1” (the sample covariance matrix) or “Qn” (the Qn estimator). The default value is “cov.1”.
R
library(robustbase)
data(stackloss)
covmat <- covMcd(stackloss)
outliers <- covmat$outliers
|
Output :
If the outliers variable is NULL, it means that no outliers were detected in the stackloss dataset using the covMcd function.
NULL
Example 3: The lmrob() function in Robustbase Package for Robust Linear Regression in R
The lmrob() is a function in the Robustbase package in R that fits a robust linear regression model to data.
Syntax:
lmrob(formula, data = NULL, method = c("MM", "S", "MM2", "S2"), control = lmrob.control(),...)
Parameters:
- formula: an object of class “formula” specifying the linear model.
- data: an optional data frame containing the variables specified in the formula.
- method: the robust method to be used, which can be one of “MM” (M-estimation), “S” (S-estimation), “MM2” (two-step M-estimation), or “S2” (two-step S-estimation).
- control: a list of control parameters to be passed to the fitting algorithm.
R
library(robustbase)
x <- seq(1, 10, length = 100)
y <- 2 * x + rnorm(100, mean = 0, sd = 1)
y[c(10, 30, 60)] <- c(20, 15, 10)
model <- lmrob(y ~ x)
plot(x, y)
abline(model, col = "red")
|
Output:
.jpg)
robust linear regression
Example 4: The colMedians() function in the Robustbase Package in R
The colMedians() is a function in the Robustbase package in R that computes the median of each column of a matrix. The function takes a matrix as its input and returns a numeric vector containing the median of each column. If the matrix contains missing values, the function automatically removes them before computing the medians.
Syntax:
colMedians(x, na.rm = TRUE)
Parameters:
- x: the matrix to compute column medians for.
- na.rm: a logical value indicating whether missing values should be removed before computing the medians (default is TRUE).
R
library(robustbase)
set.seed(123)
mat <- matrix(rnorm(100, mean = 5), ncol = 5)
mat[c(2, 5, 10)] <- c(20, -15, 30)
colMedians(mat)
|
Output:
5.38029263882571 4.86005668738249 4.96429139367999 4.78816781525497 5.35853118252101
Example 5: The outlierStats() function in the Robustbase Package in R
The outlierStats() function computes the outlier Statistics for multivariate data. It computes the Mahalanobis distance for each observation in the data set and then compares this distance to a cutoff value based on the chi-squared distribution.
Syntax:
outlierStats(x, alpha = 0.05, plot = TRUE, ...)
Parameters:
- x: is a numeric matrix or data frame containing multivariate data.
- alpha: is a significance level, which is used to determine the cutoff value for the outlier statistics.
- plot: is a logical value indicating whether to plot the outlier statistics or not. The default value is TRUE, which means that the plot will be generated.
R
library(robustbase)
data <- expand.grid(grp1 = letters[1:5], grp2 = letters[1:5], rep=1:3)
set.seed(101)
data$y <- c(rt(nrow(data), 1))
control <- lmrob.control(method = "MM", compute.outlier.stats = "S")
fit2 <- lmrob(y ~ grp1*grp2, data, control = control)
plot(fit2)
|
Output:
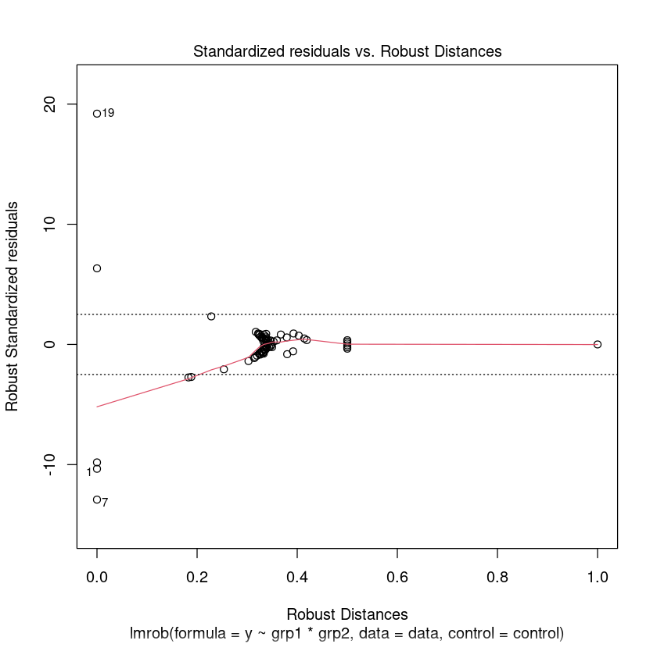
Standardized residuals vs. Robust Distances

Normal Q-Q vs. Residuals
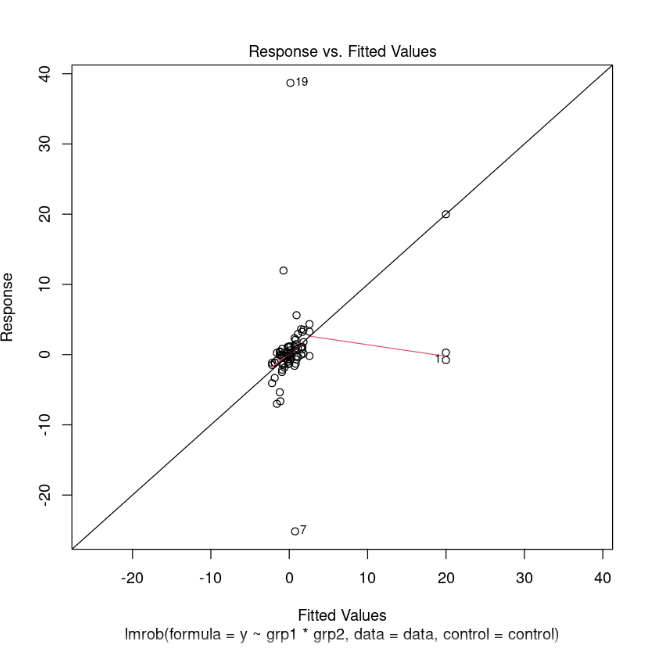
Response vs. Fitted Values

Residuals vs. Fitted Values

Sqrt of abs(residuals) vs. Fitted Values
Example 6: lmrob() and weight() functions in the Robustbase Package in R
The lmrob() function is a robust regression method provided by the Robustbase package in R. This method can handle outliers and non-normality in the data, and produce more reliable estimates of the regression coefficients. The weight() function is used to compute weights for robust linear regression.
Syntax:
lmrob(formula, data, weights,...)
Parameters:
- formula: A symbolic description of the model to be fit. The formula should be of the form response ~ predictors.
- data: A data frame containing the variables in the model.
- weights: An optional vector of weights to be used in the fitting process.
R
library(robustbase)
data(mtcars)
model <- lmrob(mpg ~ wt + drat, data = mtcars)
robustness_weights <- weights(model, type = "robustness")
print(robustness_weights)
|
Output:
Example 7: The sigma() is a function of the Robustbase Package in R
The sigma() function is used to calculate the estimate of the scale parameter of a distribution.
Syntax:
sigma(x, na.rm = FALSE)
Parameters:
- x: is a numeric vector or matrix for which the estimate of the scale parameter is to be calculated.
- na.rm: parameter is a logical value indicating whether missing values should be removed before calculating the estimate. The default value is FALSE.
R
library(robustbase)
data(coleman)
m_cl <- lm(Y ~ ., data = coleman)
sigma_m_cl <- sigma(m_cl)
sigma_m_cl
m1 <- lmrob(Y ~ ., data = coleman)
sigma_m1 <- sigma(m1)
sigma_m1
m2 <- lmrob(Y ~ ., data = coleman, setting = "KS2014")
sigma_m2 <- sigma(m2)
sigma_m2
|
Output:
2.07429596766463
1.13383554133121
0.974570103850789
Share your thoughts in the comments
Please Login to comment...