Multiple Linear Regression using R
Last Updated :
17 Sep, 2021
Prerequisite: Simple Linear-Regression using R
Linear Regression:
It is the basic and commonly used type for predictive analysis. It is a statistical approach for modeling the relationship between a dependent variable and a given set of independent variables.
These are of two types:
- Simple linear Regression
- Multiple Linear Regression
Let’s Discuss Multiple Linear Regression using R.
Multiple Linear Regression :
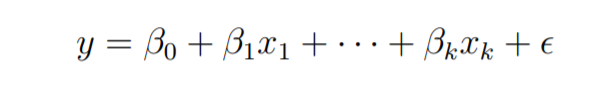
It is the most common form of Linear Regression. Multiple Linear Regression basically describes how a single response variable Y depends linearly on a number of predictor variables.
The basic examples where Multiple Regression can be used are as follows:
- The selling price of a house can depend on the desirability of the location, the number of bedrooms, the number of bathrooms, the year the house was built, the square footage of the lot, and a number of other factors.
- The height of a child can depend on the height of the mother, the height of the father, nutrition, and environmental factors.
Estimation of the Model Parameters
Consider a multiple linear Regression model with k independent predictor variable x1, x2……, xk, and one response variable y.
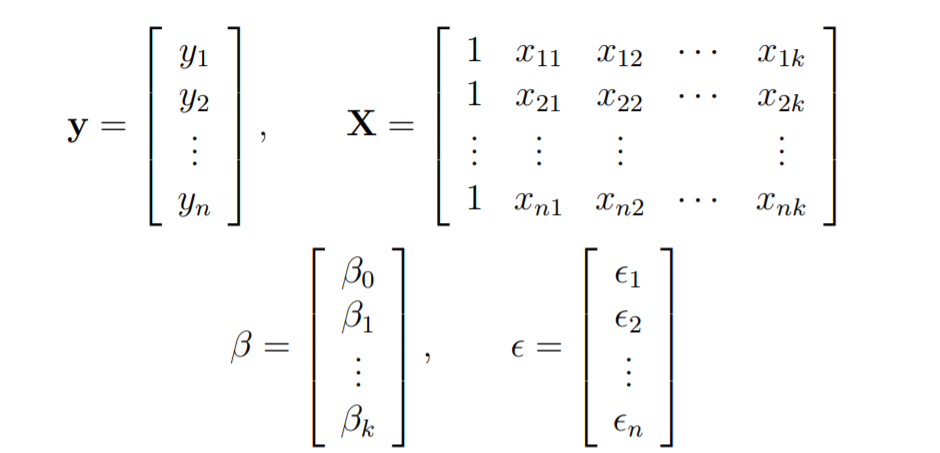
Suppose we have n observation on the k+1 variables and the variable of n should be greater than k.

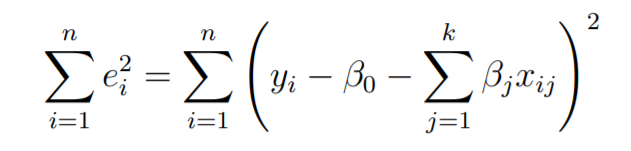
The basic goal in least-squares regression is to fit a hyper-plane into (k + 1)-dimensional space that minimizes the sum of squared residuals.
Before taking the derivative with respect to the model parameters set them equal to zero and derive the least-squares normal equations that the parameters would have to fulfill.
These equations are formulated with the help of vectors and matrices.
Let
The linear Regression model is written in the form as follows:
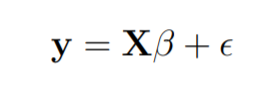
In linear regression the least square parameters estimate b
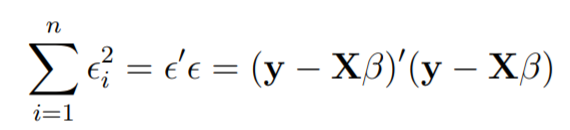
Imagine the columns of X to be fixed, they are the data for a specific problem and say b to be variable. We want to find the “best” b in the sense that the sum of squared residuals is minimized.
The smallest that the sum of squares could be is zero.
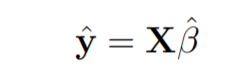
Here y is the estimated response vector.
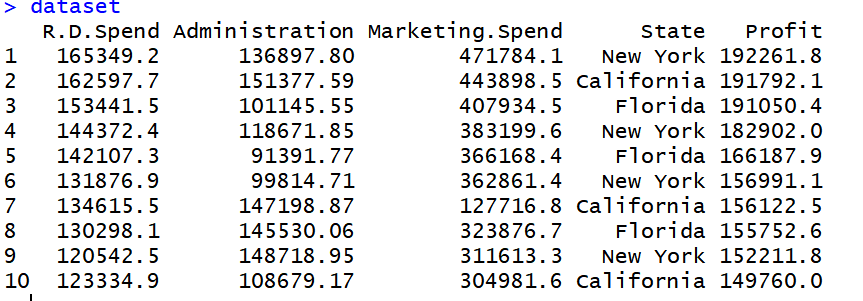
Following R code is used to implement Multiple Linear Regression on following dataset data2.
the dataset looks like this:
R
dataset = read.csv('data2.csv')
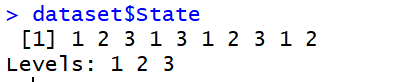
dataset$State = factor(dataset$State,
levels = c('New York', 'California', 'Florida'),
labels = c(1, 2, 3))
dataset$State
|
R
library(caTools)
set.seed(123)
split = sample.split(dataset$Profit, SplitRatio = 0.8)
training_set = subset(dataset, split == TRUE)
test_set = subset(dataset, split == FALSE)
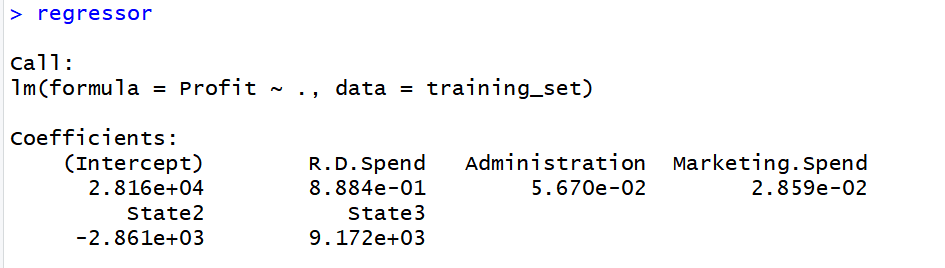
regressor = lm(formula = Profit ~ .,
data = training_set)
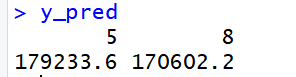
y_pred = predict(regressor, newdata = test_set)
|
Output:
Share your thoughts in the comments
Please Login to comment...