IPL 2023 Data Analysis using Pandas AI
Last Updated :
08 Jun, 2023
We are already familiar with performing data analysis using Pandas, in this article, we will see how we can leverage the power of PandasAI to perform analysis on IPL 2023 Auction dataset.
We have already covered the Introduction to PandasAI. You can check out our blog post here.
Data Analysis using Pandas AI
Step 1: Install pandasai and openai library in your Python environment by executing the following command in Jupyter Notebook
!pip install -q pandasai
Step 2: Import the necessary libraries
Python3
import pandas as pd
from pandasai import PandasAI
from pandasai.llm.openai import OpenAI
|
Step 3: Initialize an instance of OpenAI LLM and pass it’s API key
Python3
OPENAI_API_KEY = "your_api_key"
llm = OpenAI(api_token=OPENAI_API_KEY)
pandas_ai = PandasAI(llm)
|
Step 4: Import the IPL 2023 Auction dataset using pandas
We are using the IPL 2023 Auction dataset here. You can download the csv file from here.
Python3
df = pd.read_csv('IPL_Squad_2023_Auction_Dataset.csv')
print(df.shape)
df.head()
|
Output:
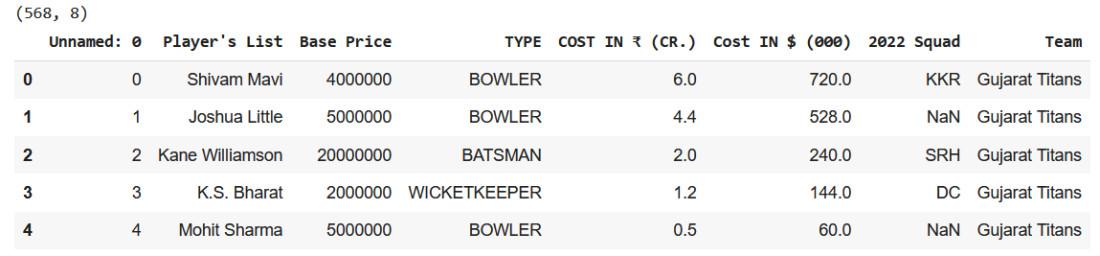
IPL 2023 Auction dataset
Step 5: Drop the “Unnamed: 0” column from the above dataset
Python3
df.drop(['Unnamed: 0'], axis=1, inplace=True)
df.head()
|
Output:
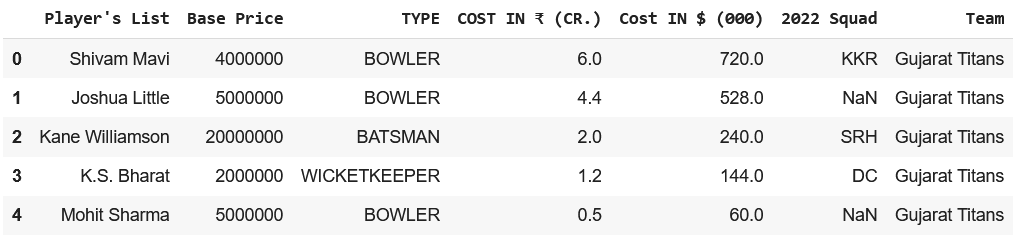
IPL 2023 Auction dataset
Step 6: Data Analysis using PandasAI
Now let’s begin our analysis:
Prompt 1:
Python3
pandas_ai.run(df, prompt="Which players are the most costliest buys?")
|
Output:
['Sam Curran', 'Cameron Green', 'Ben Stokes']
Prompt 2:
Python3
prompts =
pandas_ai.run(df, prompt=prompts)
|
Output:
Well, it looks like the cheapest buys this season were Glenn Phillips for Sunrisers Hyderabad,
Raj Angad Bawa and Rishi Dhawan for Punjab Super Kings, Dhruv Jurel and K.C Cariappa
for Rajasthan Royals, and many more. The full list includes 163 players and their respective teams.
Prompt 3:
Python3
prompts =
pandas_ai.run(df, prompt=prompts)
|
Output:
.png)
Prompt 4:
Python3
pandas_ai.run(df, prompt="How many bowler remained unsold and what was their base price?")
|
Output:
There were 108 bowlers who remained unsold in the auction.
Their base price ranged from 2 million to 20 million.
Prompt 5:
Python3
pandas_ai.run(df, prompt="How many players remained unsold this season?")
|
Output:
('Number of players remained unsold this season:', 338)
Prompt 6:
Python3
pandas_ai.run(df, prompt="Which type of players were majorly unsold?")
|
Output:
     Player's List Base Price          TYPE  COST IN ₹ (CR.)  Cost IN $ (000)  \
0      Shivam Mavi    4000000        BOWLER              6.0            720.0
2  Kane Williamson   20000000       BATSMAN              2.0            240.0
3      K.S. Bharat    2000000  WICKETKEEPER              1.2            144.0
5      Odean Smith    5000000   ALL-ROUNDER              0.5             60.0
7    Rahul Tewatia   Retained   ALL-ROUNDER              0.0              0.0
  2022 Squad            Team
0        KKR  Gujarat Titans
2        SRH  Gujarat Titans
3         DC  Gujarat Titans
5       PBKS  Gujarat Titans
7         GT  Gujarat Titans
TYPE
ALL-ROUNDER     65
BOWLER          64
BATSMAN         35
WICKETKEEPER    21
Name: TYPE, dtype: int64
Number of unsold players: 0
Prompt 7:
Python3
pandas_ai.run(df, prompt="Who are three new players Gujrat picked?")
|
Output:
0        Shivam Mavi
1      Joshua Little
2    Kane Williamson
Name: Player's List, dtype: object
Prompt 8:
Python3
pandas_ai.run(df, prompt="What is total money spent by all teams in dollars?")
|
Output:
The total amount of money spent by all teams in the auction is $20,040,000.
Prompt 9:
Python3
prompts =
pandas_ai.run(df, prompt=prompts)
|
Output:
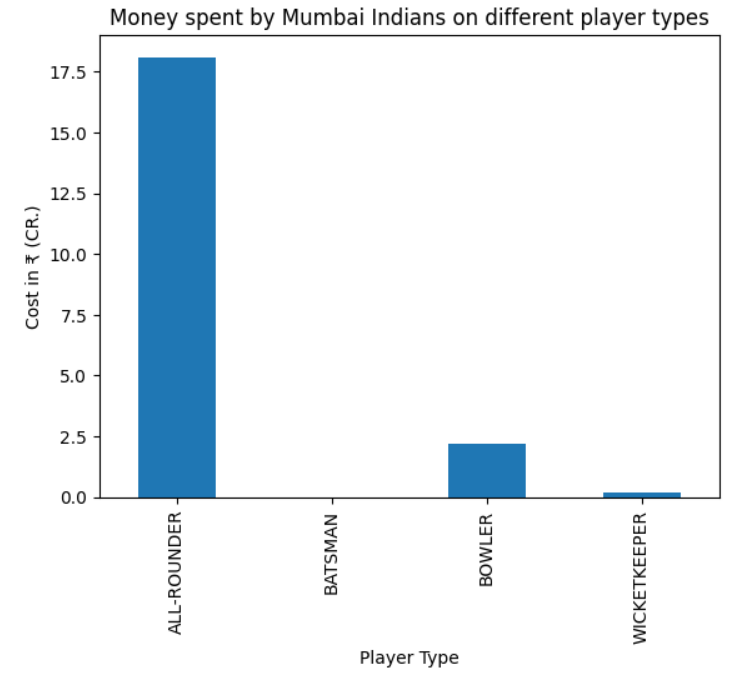
Bar graph for Money spent by Mumbai Indians on each type of player
Sure, I can help you with that! To answer your question, I can draw a barplot that shows how much money the Mumbai Indians spent on all types of players. Would you like me to do that for you now?
Prompt 10:
Python3
prompts =
pandas_ai.run(df, prompt=prompts)
|
Output:
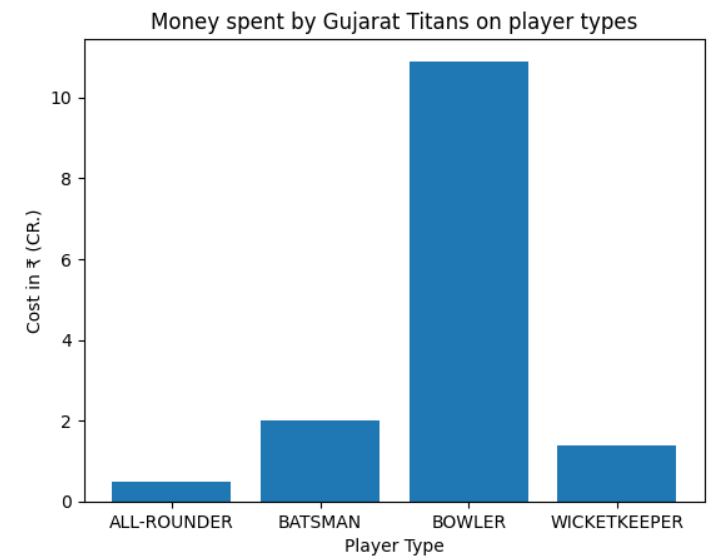
Bar plot showing money spent on each type of player by Gujrat Titans
Prompt 11:
Python3
pandas_ai.run(df, prompt="Can you predict which team will buy Sam Curran in 2024?")
|
Output:
Lucknow Super Giants
Prompt 12:
Python3
print(pandas_ai.run(df, prompt="Can you predict which team will spend the highest money in 2024?"))
|
Output:
     Player's List Base Price          TYPE  COST IN ₹ (CR.)  Cost IN $ (000)  \
0      Shivam Mavi    4000000        BOWLER              6.0            720.0
2  Kane Williamson   20000000       BATSMAN              2.0            240.0
3      K.S. Bharat    2000000  WICKETKEEPER              1.2            144.0
5      Odean Smith    5000000   ALL-ROUNDER              0.5             60.0
7    Rahul Tewatia   Retained   ALL-ROUNDER              0.0              0.0
  2022 Squad            Team
0        KKR  Gujarat Titans
2        SRH  Gujarat Titans
3         DC  Gujarat Titans
5       PBKS  Gujarat Titans
7         GT  Gujarat Titans
The team that will spend the highest money in 2024 is: Lucknow Super Giants
Prompt 13:
Python3
pandas_ai.run(df, prompt="Perform univariate analysis")
|
Output:
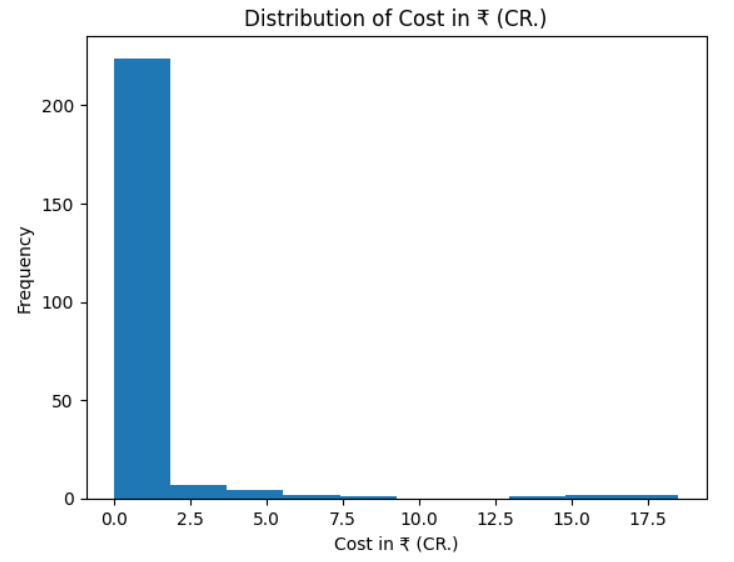
Histogram of Cost Attribute in dataset
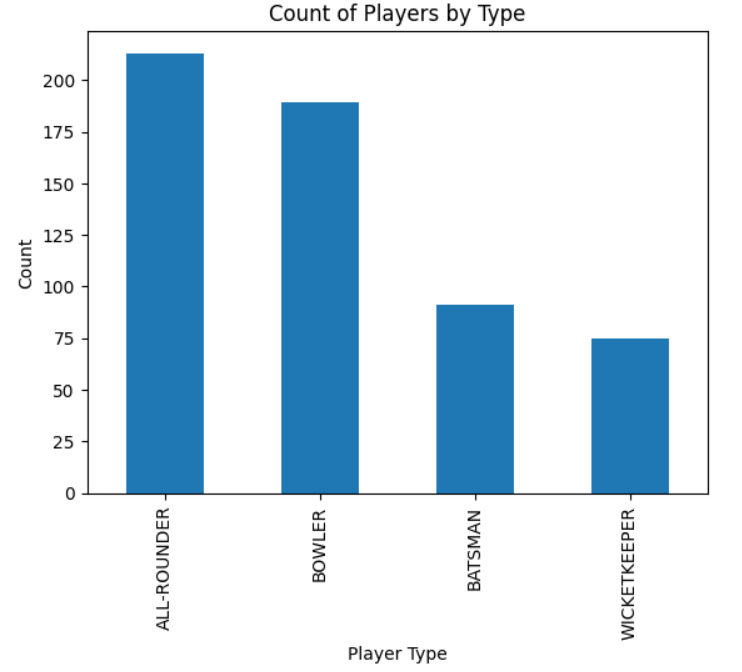
Bar graph visualizing Count of each type of player

Pie Chart showing Percentage of players in 2022 squad
Sure! Based on the data provided, the univariate analysis shows that we have six variables: Player's List, Base Price, TYPE, COST IN ₹ (CR.), Cost IN $ (000), 2022 Squad, and Team. The data types for these variables are object, object, object, float64, float64, and object respectively.
Prompt 14:
Python3
pandas_ai.run(df, prompt="Perform multivariate analysis")
|
Output:
Unfortunately, I was not able to answer your question. Please try again. If the problem persists, try rephrasing your question.
For this input, PandasAI seems to have failed as the complexity and ambiguity increased.
Pros of Pandas AI
- Pandas AI works well on direct and well-explained inputs.
- Can easily perform simple tasks like plotting graphs, and univariate analysis.
- Can perform basic statistical operations.
- Also, can make basic predictions sometimes.
Cons of Pandas AI
Frequently Asked Questions (FAQs)
1. Is pandas used for AI?
Pandas AI is a new Python module that enhances Pandas, a widely used tool for data analysis and manipulation, by introducing generative artificial intelligence capabilities.
2. What is the data analysis process in AI?
The process of turning a raw dataset into insightful knowledge is known as data analytics. This project aims to create solutions that will assist in automating the data analytics process by utilising recent developments in artificial intelligence and machine learning.
3. Is data preprocessing needed for PandasAI?
Basically, PandasAI extract the keywords from the prompt given. and make the all the analysis accrding. It perform the same process which is done by a user in Pandas. So, data preprocessing can also perfomed by PandasAI in backened. Therefore data preprocessing is not the essential part for PandasAI
4. How fast can PandasAI analyze data?
PandasAI works with the server which is connected with internet. So, that it’s process is slower compare to Pandas.
Conclusion
In this article, we discussed how to perform some simple analysis on a dataset. Pandas AI seems to have worked beautifully on simple and easy tasks. But it still has its limitations, like not being able to perform complex tasks like outlier analysis, clustering, etc., and fails to give outputs for ambiguous inputs. Pandas AI seems to be great for quick analysis and for beginners, but when it comes to a full-fledged EDA we should prefer our standard libraries: NumPy, pandas, seaborn, matplotlib, etc.
Share your thoughts in the comments
Please Login to comment...