The Entity Relational Model is a model for identifying entities to be represented in the database and representation of how those entities are related. The ER data model specifies enterprise schema that represents the overall logical structure of a database graphically.
The Entity Relationship Diagram explains the relationship among the entities present in the database. ER models are used to model real-world objects like a person, a car, or a company and the relation between these real-world objects. In short, the ER Diagram is the structural format of the database.
Why Use ER Diagrams In DBMS?
- ER diagrams are used to represent the E-R model in a database, which makes them easy to convert into relations (tables).
- ER diagrams provide the purpose of real-world modeling of objects which makes them intently useful.
- ER diagrams require no technical knowledge and no hardware support.
- These diagrams are very easy to understand and easy to create even for a naive user.
- It gives a standard solution for visualizing the data logically.
Symbols Used in ER Model
ER Model is used to model the logical view of the system from a data perspective which consists of these symbols:
- Rectangles: Rectangles represent Entities in the ER Model.
- Ellipses: Ellipses represent Attributes in the ER Model.
- Diamond: Diamonds represent Relationships among Entities.
- Lines: Lines represent attributes to entities and entity sets with other relationship types.
- Double Ellipse: Double Ellipses represent Multi-Valued Attributes.
- Double Rectangle: Double Rectangle represents a Weak Entity.

Symbols used in ER Diagram
Components of ER Diagram
ER Model consists of Entities, Attributes, and Relationships among Entities in a Database System.

Components of ER Diagram
Entity
An Entity may be an object with a physical existence – a particular person, car, house, or employee – or it may be an object with a conceptual existence – a company, a job, or a university course.
Entity Set: An Entity is an object of Entity Type and a set of all entities is called an entity set. For Example, E1 is an entity having Entity Type Student and the set of all students is called Entity Set. In ER diagram, Entity Type is represented as:

Entity Set
1. Strong Entity
A Strong Entity is a type of entity that has a key Attribute. Strong Entity does not depend on other Entity in the Schema. It has a primary key, that helps in identifying it uniquely, and it is represented by a rectangle. These are called Strong Entity Types.
2. Weak Entity
An Entity type has a key attribute that uniquely identifies each entity in the entity set. But some entity type exists for which key attributes can’t be defined. These are called Weak Entity types.
For Example, A company may store the information of dependents (Parents, Children, Spouse) of an Employee. But the dependents can’t exist without the employee. So Dependent will be a Weak Entity Type and Employee will be Identifying Entity type for Dependent, which means it is Strong Entity Type.
A weak entity type is represented by a Double Rectangle. The participation of weak entity types is always total. The relationship between the weak entity type and its identifying strong entity type is called identifying relationship and it is represented by a double diamond.

Strong Entity and Weak Entity
Attributes
Attributes are the properties that define the entity type. For example, Roll_No, Name, DOB, Age, Address, and Mobile_No are the attributes that define entity type Student. In ER diagram, the attribute is represented by an oval.

Attribute
1. Key Attribute
The attribute which uniquely identifies each entity in the entity set is called the key attribute. For example, Roll_No will be unique for each student. In ER diagram, the key attribute is represented by an oval with underlying lines.

Key Attribute
2. Composite Attribute
An attribute composed of many other attributes is called a composite attribute. For example, the Address attribute of the student Entity type consists of Street, City, State, and Country. In ER diagram, the composite attribute is represented by an oval comprising of ovals.
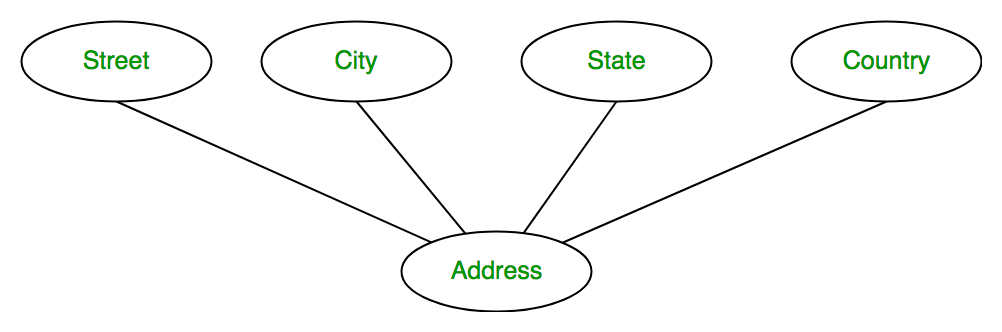
Composite Attribute
3. Multivalued Attribute
An attribute consisting of more than one value for a given entity. For example, Phone_No (can be more than one for a given student). In ER diagram, a multivalued attribute is represented by a double oval.

Multivalued Attribute
4. Derived Attribute
An attribute that can be derived from other attributes of the entity type is known as a derived attribute. e.g.; Age (can be derived from DOB). In ER diagram, the derived attribute is represented by a dashed oval.

Derived Attribute
The Complete Entity Type Student with its Attributes can be represented as:
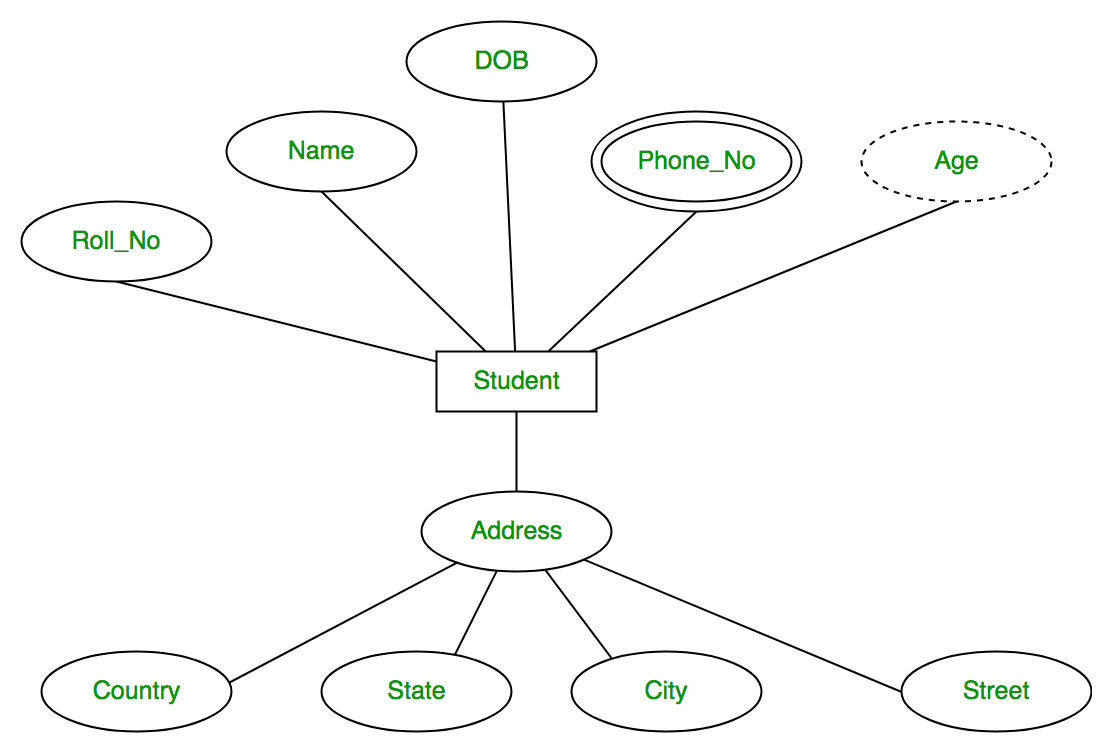
Entity and Attributes
Relationship Type and Relationship Set
A Relationship Type represents the association between entity types. For example, ‘Enrolled in’ is a relationship type that exists between entity type Student and Course. In ER diagram, the relationship type is represented by a diamond and connecting the entities with lines.
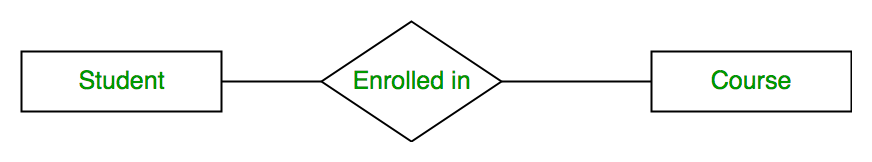
Entity-Relationship Set
A set of relationships of the same type is known as a relationship set. The following relationship set depicts S1 as enrolled in C2, S2 as enrolled in C1, and S3 as registered in C3.

Relationship Set
Degree of a Relationship Set
The number of different entity sets participating in a relationship set is called the degree of a relationship set.
1. Unary Relationship: When there is only ONE entity set participating in a relation, the relationship is called a unary relationship. For example, one person is married to only one person.

Unary Relationship
2. Binary Relationship: When there are TWO entities set participating in a relationship, the relationship is called a binary relationship. For example, a Student is enrolled in a Course.
Binary Relationship
3. Ternary Relationship: When there are n entities set participating in a relation, the relationship is called an n-ary relationship.
Cardinality
The number of times an entity of an entity set participates in a relationship set is known as cardinality. Cardinality can be of different types:
1. One-to-One: When each entity in each entity set can take part only once in the relationship, the cardinality is one-to-one. Let us assume that a male can marry one female and a female can marry one male. So the relationship will be one-to-one.
the total number of tables that can be used in this is 2.

one to one cardinality
Using Sets, it can be represented as:

Set Representation of One-to-One
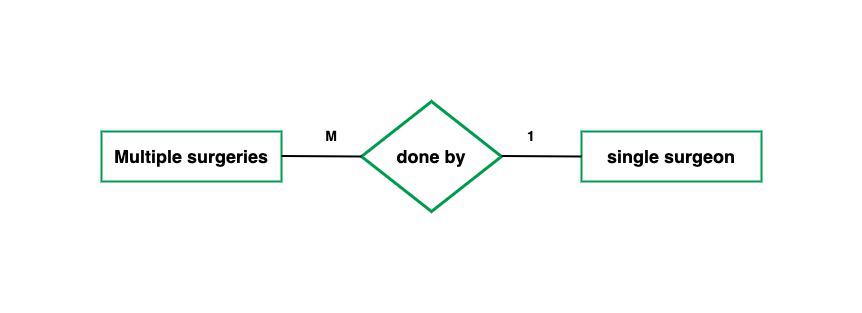
2. One-to-Many: In one-to-many mapping as well where each entity can be related to more than one entity and the total number of tables that can be used in this is 2. Let us assume that one surgeon department can accommodate many doctors. So the Cardinality will be 1 to M. It means one department has many Doctors.
total number of tables that can used is 3.

one to many cardinality
Using sets, one-to-many cardinality can be represented as:

Set Representation of One-to-Many
3. Many-to-One: When entities in one entity set can take part only once in the relationship set and entities in other entity sets can take part more than once in the relationship set, cardinality is many to one. Let us assume that a student can take only one course but one course can be taken by many students. So the cardinality will be n to 1. It means that for one course there can be n students but for one student, there will be only one course.
The total number of tables that can be used in this is 3.
many to one cardinality
Using Sets, it can be represented as:

Set Representation of Many-to-One
In this case, each student is taking only 1 course but 1 course has been taken by many students.
4. Many-to-Many: When entities in all entity sets can take part more than once in the relationship cardinality is many to many. Let us assume that a student can take more than one course and one course can be taken by many students. So the relationship will be many to many.
the total number of tables that can be used in this is 3.

many to many cardinality
Using Sets, it can be represented as:

Many-to-Many Set Representation
In this example, student S1 is enrolled in C1 and C3 and Course C3 is enrolled by S1, S3, and S4. So it is many-to-many relationships.
Participation Constraint
Participation Constraint is applied to the entity participating in the relationship set.
1. Total Participation – Each entity in the entity set must participate in the relationship. If each student must enroll in a course, the participation of students will be total. Total participation is shown by a double line in the ER diagram.
2. Partial Participation – The entity in the entity set may or may NOT participate in the relationship. If some courses are not enrolled by any of the students, the participation in the course will be partial.
The diagram depicts the ‘Enrolled in’ relationship set with Student Entity set having total participation and Course Entity set having partial participation.

Total Participation and Partial Participation
Using Set, it can be represented as,

Set representation of Total Participation and Partial Participation
Every student in the Student Entity set participates in a relationship but there exists a course C4 that is not taking part in the relationship.
How to Draw ER Diagram?
- The very first step is Identifying all the Entities, and place them in a Rectangle, and labeling them accordingly.
- The next step is to identify the relationship between them and place them accordingly using the Diamond, and make sure that, Relationships are not connected to each other.
- Attach attributes to the entities properly.
- Remove redundant entities and relationships.
- Add proper colors to highlight the data present in the database.
Share your thoughts in the comments
Please Login to comment...