how to profile C++ code running in Linux
Last Updated :
13 Dec, 2023
In Linux, Profiling C++ code is an important process in optimizing and understanding the overall performance metrics of our program. The profiling process consists of the tasks of analyzing the execution time of various functions which we have implemented in our code, this also allows us to identify the bottlenecks and the areas of improvement. So, in this article, we will see how we can profile C++ code using the GNU Profiler (gprof) on the Kali Linux Operating System.
Why to Profile C++ Code Running in Linux?
Profiling C++ Code which is running in Linux is a crucial step, that helps in improving the performance and optimizing the program. Along, with this below is some of the reasons stating the need to profile C++ Code.
- Identify Performance Bottlenecks: Profiling pinpoints code sections consuming significant execution time.
- Optimize Critical Paths: Focus optimization efforts on crucial areas for maximum impact.
- Memory Usage Analysis: Detect and address memory leaks, inefficient allocations, and excessive usage.
- Enhance Code Maintainability: Profiling encourages cleaner, more maintainable code by revisiting and refactoring.
- Validate Optimization Changes: Measure performance before and after modifications to ensure the desired impact.
- Prepare for Scalability: Early performance improvements support scalability in growing applications.
- Meet Performance Requirements: Essential for real-time systems or applications with strict performance standards.
What is GNU Profiler (gprof)?
GNU Profiler, commonly referred to as gprof, is a profiling tool provided by the GNU Compiler Collection (GCC). It is designed to help developers analyze the execution time of functions within a program. gprof generates detailed reports that show the amount of time spent in each function, as well as the calls between functions.
Features:
- Function-Level Profiling: gprof provides information about the time spent in each function, the number of calls made to each function, and the percentage of total program execution time attributed to each function.
- Generates Call Graphs: The tool generates call graphs that illustrate the flow of control between functions, helping developers visualize the relationships and dependencies within their code.
- Flat Profile and Call Graph Profile: gprof produces both a flat profile, which provides information about each function independently, and a call graph profile, which shows the hierarchical structure of function calls.
- Accurate Sampling: gprof uses statistical sampling to gather data on function execution times. This allows developers to profile programs without significantly affecting their performance.
How to Profile C++ Code Running in Linux?
In this section, we will see how we can profile the C++ Code which is Running in Linux. So follow the below steps along with command executions to monitor and profile the C++ Code in Linux without any issue or problem.
Step 1: Open the Terminal
In the very first step, we need to have an active terminal, through which the entire profile of profiling will be done. In Linux, we can open the terminal by navigating to the Applications Menu or by using the Keyboard shortcut “Ctrl + ALT + T” to open the terminal.
Open the Terminal
Step 2: Update Repositories
Once the terminal is been launched, we need to update the repositories using the apt manager. Updating the repositories will help ensure the proper installation of all prerequisites like gprof and g++ compiler. So execute the below command to update the repositories.
sudo apt update
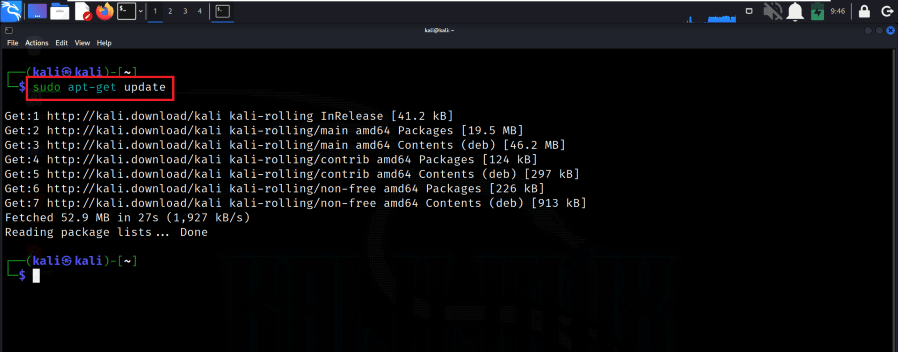
Update Repositories
Step 3: Install GCC
After updating the repository, we need to install GNU Compiler Collection or GCC. If you haven’t installed it earlier, then you need to execute the below command to install it on your Linux system. GCC is a collection of compilers and tools for completing and optimizing code that is within the languages of C, C++, Fortran, Ada, etc.
sudo apt-get install build-essential
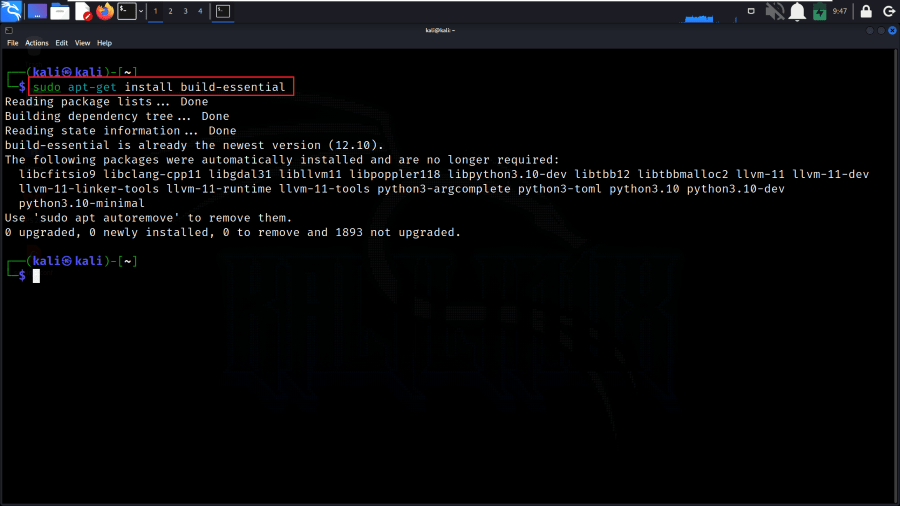
Install GCC
Step 4: Install gprof
As we are using the gprof Profiler to profile the C++ code in Linux, we need to install gprof on our system. If it is not installed on the system, you need to install it by using the below command.
sudo apt-get install binutils
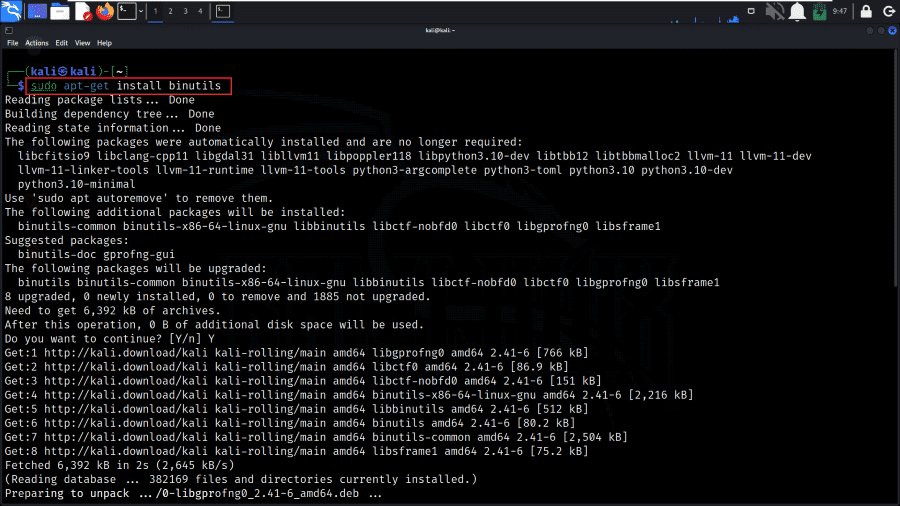
Install gprof
Step 5: Create C++ Program File
Once all the prerequisites are installed, we need to create a C++ Program file using a text editor. We will be using the nano text editor. So execute the below command to create the C++ program file using the nano editor.
nano main.cpp
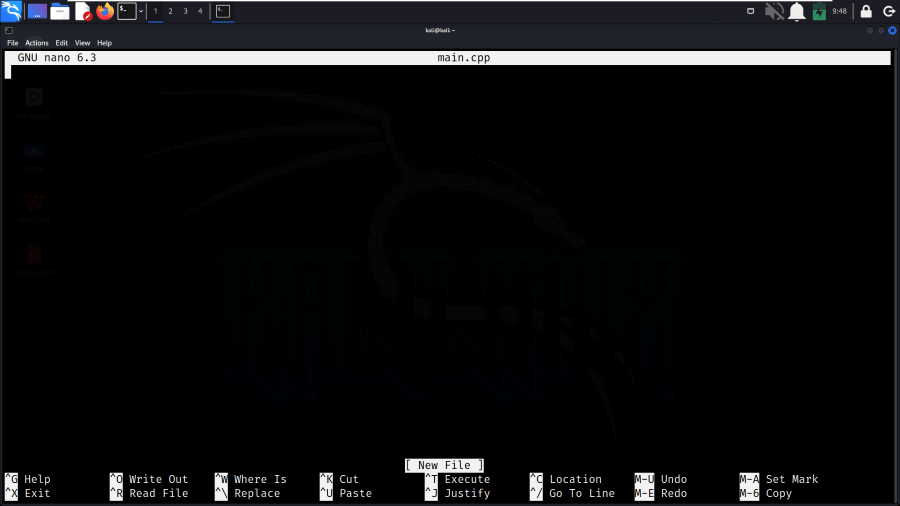
Create C++ Program File
Step 6: Write C++ Program Code
Once the file is created, we need to write the code we will be profiling using the gprof. Below we have added the C++ program code.
C++
#include <iostream>
#include <cstdlib>
#include <cmath>
void fastFunction() {
double result = 0.0;
for (int i = 1; i <= 1000000; ++i) {
result += std::sin(i) * std::cos(i);
}
}
void slowFunction() {
double result = 0.0;
for (int i = 1; i <= 3000000; ++i) {
result += std::sqrt(i) * std::log(i);
}
}
int main() {
std::cout << "Profiling Example Program\n";
for (int i = 0; i < 5; ++i) {
fastFunction();
slowFunction();
}
std::cout << "Program completed.\n";
return EXIT_SUCCESS;
}
|
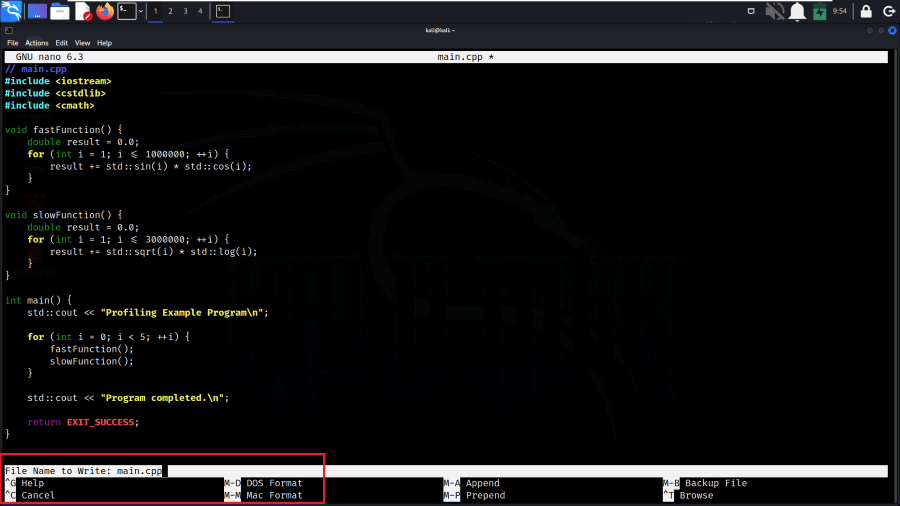
Write C++ Program Code
The above program has two functions, fastFunction and slowFunction, each containing computationally intensive operations. It is designed for profiling purposes to showcase the use of profiling tools like gprof. The function’s differing complexities provide a basis for analyzing time distribution and identifying performance bottlenecks during program execution.
Step 7: Compile with Profiling Flags
Now, we need to compile the C++ program with the -pg flag using the GNU Compiler (g++). The -pg flag performs the executable with profiling code, allowing the subsequent execution to generate data for performance analysis using gprof.
g++ -pg -o my_program main.cpp
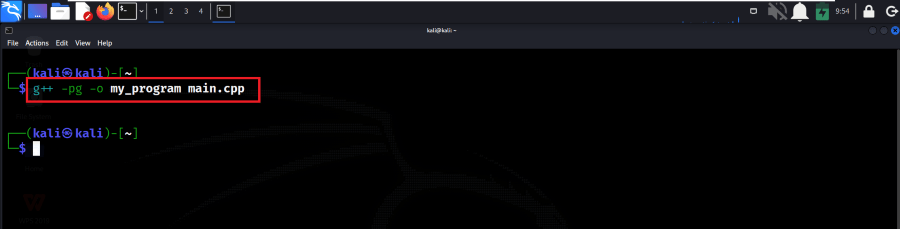
Compile with Profiling Flags
Step 8: Run the Program
Now, by using the below command, we can run the program. If the program is executed with the output, then we can say that the program is running in the proper desired manner.
./my_program
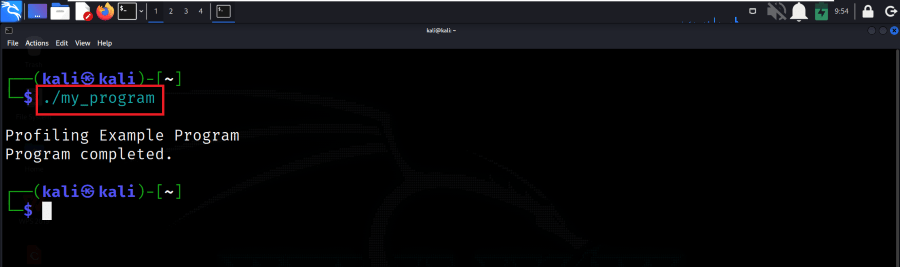
Run the Program
Step 9: Generate Profiling Data
After running the program, execute the below gprof command to generate profiling data files. The gprof will generate all the performance metrics of each function in the C++ program along with the insights like time elapsed and more details.
gprof my_program gmon.out > analysis.txt
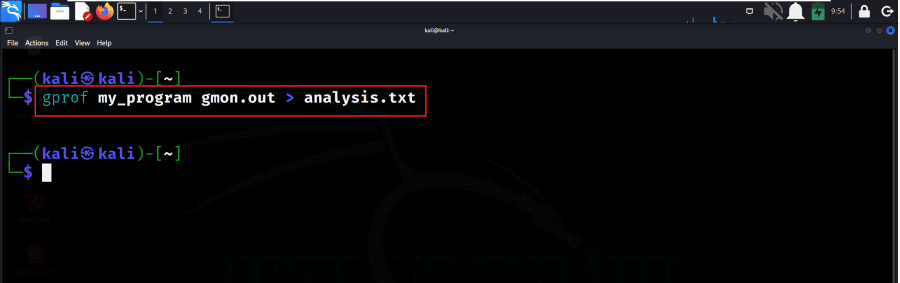
Generate Profiling Data
Step 10: View Profiling Information
Now, by using the cat command or by using the editors we can view the output profiled information.
cat analysis.txt
In the below output screenshot, we can see the total time, percentage of total program time, average time per call for each function, and other insightful information.
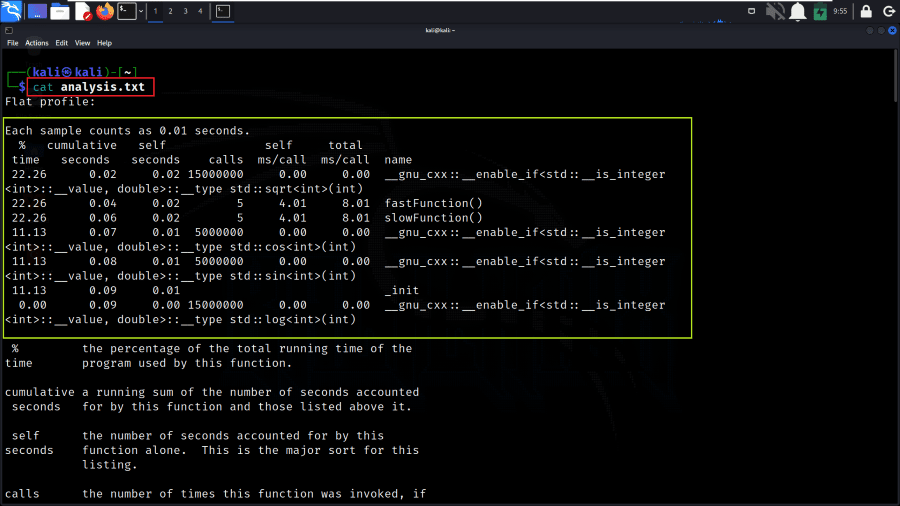
Output 1
In the below output, we can see the complete total time of each function to perform the computations that are specified in the C++ program code.
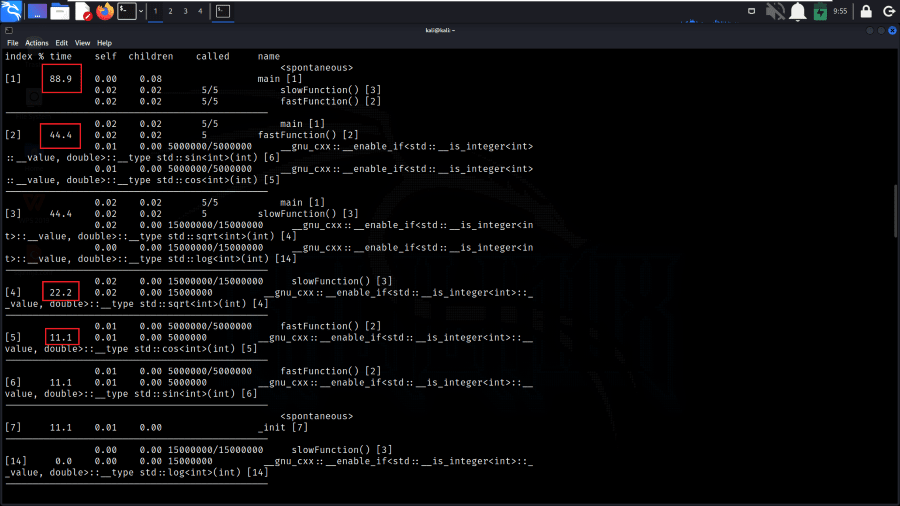
Output 2
Conclusion
In conclusion, to profile C++ code in Linux, we can use tools like gprof. Compile your code with the -pg flag, run the executable, and then generate a profiling report. The resulting analysis helps identify time-consuming functions, allowing developers to optimize critical sections for improved performance and efficiency. Profiling allows developers to make informed decisions, enabling the creation of more scalable, reliable, and resource-efficient C++ applications.
Share your thoughts in the comments
Please Login to comment...