‘forcats’ is a package in R Programming that provides tools for working with categorical (factor) variables. Categorical variables are variables that take on a limited, discrete set of values or levels, and are used to represent qualitative or nominal data. Some examples of categorical variables include gender (male/female), race (white/black/asian/other), and education level (high school/bachelor’s/master’s/doctorate).
The forcats package provides a variety of functions that allow you to manipulate and transform categorical variables in different ways. We will discuss some of the main functions along with their purpose in this article.
Installation of Forcats Package:
To use the ‘forcats’ package, you first need to install it from the Comprehensive R Archive Network (CRAN). You can do this using the following command:
R
install.packages("forcats")
|
Usage of Forcats package in R Programming:
Important functions in Forcats Package
The ‘forcats’ package provides a number of functions for manipulating factors. Here are a few examples of some of the most commonly used functions.
1. fct_relevel()
The fct_relevel function is used in R programming language to reorder the levels of a factor variable. It takes a factor as its first argument, followed by the desired order of levels in which they should appear in the output. The function returns a new factor with the same values as the original factor, but with the levels reordered according to the specified order.
Syntax:
Parameters: `.f`
object: The factor variable to be reordered.
Syntax:
Parameters: `…`
object: A series of strings that represent the levels of the factor variable, listed in the order you want them to appear
Example:
R
library(ggplot2)
library(forcats)
ggplot(diamonds, aes(x = cut)) +
geom_bar()
|
Output:
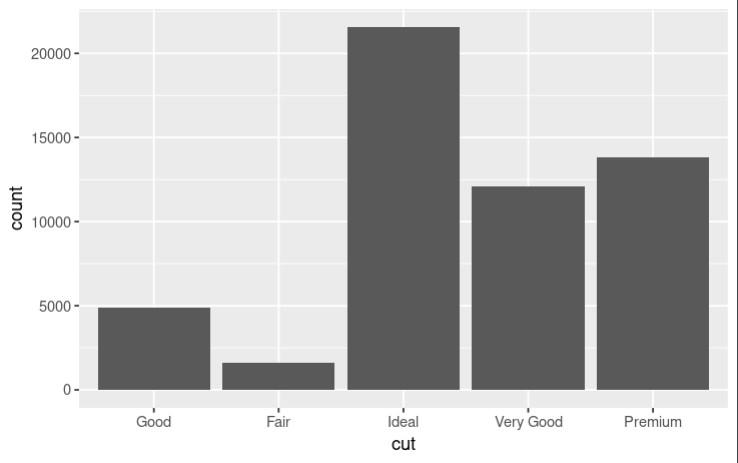
Without using fct_relevel()
R
library(ggplot2)
ggplot(diamonds, aes(x = cut)) +
geom_bar()
diamonds$cut <- fct_relevel(diamonds$cut, "Fair", "Good", "Very Good", "Premium", "Ideal")
ggplot(diamonds, aes(x = cut)) +
geom_bar()
|
Output:
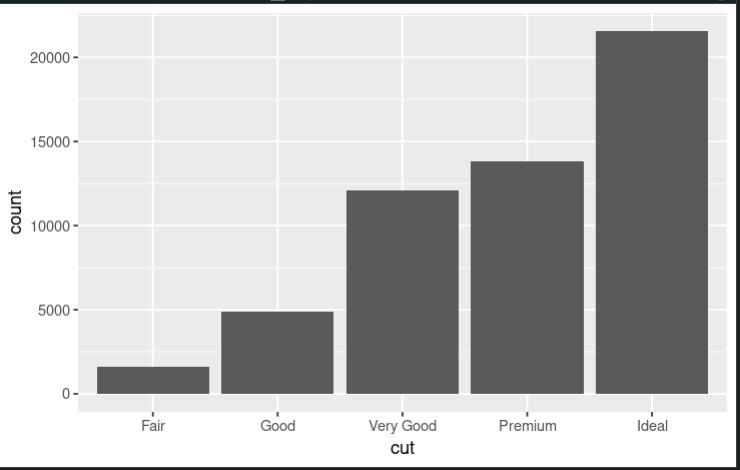
After using fct_relevel()
Explanation:
In the first plot, the levels of the cut variable are displayed in alphabetical order. However, it may be more useful to order the levels from worst to best (i.e., Fair, Good, Very Good, Premium, Ideal). The fct_relevel() function can be used to reorder the levels of the cut variable in this way. In the second plot, the levels of the cut variable are displayed in the desired order, making it easier to compare the frequency of each type of cut.
2. fct_reorder()
The fct_reorder() function in the forcats package of R programming is used to reorder factors in a variable based on a specified function. It takes the variable to be reordered, the function used to reorder the factors, and an optional argument to specify the order. The levels are reordered based on the values returned by the function.
Syntax:
Parameters: `x`
object:The variable used to determine the order of the factor levels.
Syntax:
Parameters: `fun`
object:The summary function to use for computing the order of the factor levels based on the values of `x`.
Example:
R
library(ggplot2)
library(forcats)
data(mpg)
ggplot(mpg, aes(x = fct_reorder(manufacturer, hwy, median))) +
geom_boxplot(aes(y = hwy))
|
Output:
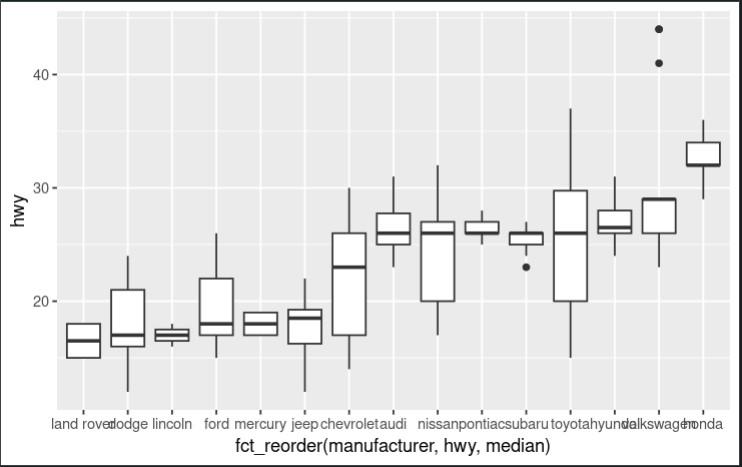
fct_reorder()
Explanation:
In this example, we’re creating a boxplot of highway miles per gallon (hwy) by manufacturer. We’re using fct_reorder() to reorder the levels of the manufacturer variable based on the median hwy value for each group. This ensures that the boxplot is ordered by the median highway miles per gallon for each manufacturer.
3. fct_collapse()
The fct_collapse() function can be used to collapse multiple levels of a factor into a single level. This can be useful when you want to group together levels that are similar in some way.
Syntax:
Parameters: `f`
object:The factor variable to be collapsed.
Syntax:
Parameters: `…`
object:A set of named character vectors, where each vector contains the names of the levels to be collapsed into a single group. The names of the vectors are used as the new levels for the collapsed groups.
Example:
R
fruit <- factor(c("apple", "banana", "orange", "grape", "peach", "plum"))
fruit2 <- fct_collapse(fruit, other = c("grape", "peach", "plum"))
table(fruit)
table(fruit2)
|
Output:
Explanation:
It creates a factor variable called fruit with six levels. The fct_collapse() function is then used to collapse the last three levels (grape, peach, and plum) into a single level called other, resulting in a new factor variable called fruit2.
4. fct_infreq()
The fct_infreq() function in the forcats package in R allows you to reorder the levels of a factor variable based on their frequency of occurrence, with the most frequent levels appearing first.
Syntax:
Parameters: `f`
object:The factor variable to be reordered.
Syntax:
Parameters: `n`
object:The number of most frequent levels to keep, or a proportion of total observations to keep.
R
library(forcats)
library(ggplot2)
ggplot(diamonds, aes(x = cut)) +
geom_bar()
diamonds$cut <- fct_infreq(diamonds$cut)
ggplot(diamonds, aes(x = cut)) +
geom_bar()
|
Output:
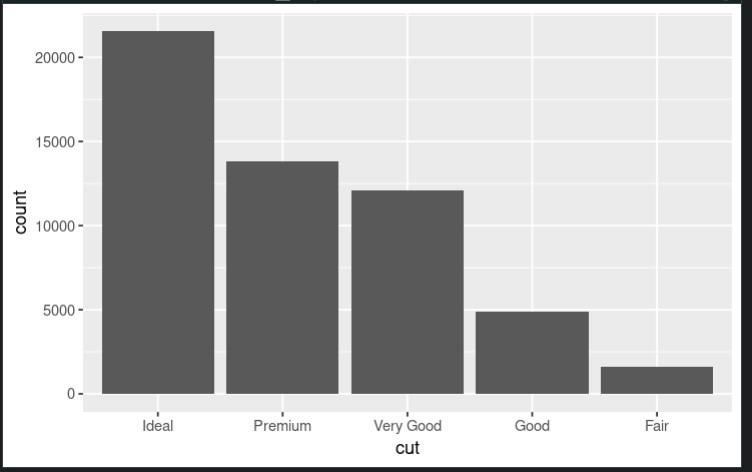
fct_infreq()
Explanation:
In this example, we are using the fct_infreq() function from the forcats package to reorder the levels of a factor variable by frequency. We start by creating a bar plot of the cut variable in the diamonds dataset using ggplot2. This plot shows the count of diamonds for each level of the cut variable, but the levels are not ordered by frequency.
We then use fct_infreq() to reorder the levels of the cut variable by frequency. The resulting factor variable is assigned back to the diamonds$cut column. Finally, we create a new bar plot of the reordered cut variable using ggplot2. This plot shows the count of diamonds for each level of the cut variable, ordered from most to least frequent.
5. fct_shift()
The fct_shift() function in the forcats package in R allows you to shift the levels of a factor variable up or down by a specified number of positions.
Syntax:
Parameters: `f`
object:The factor variable to be shifted.
Syntax:
Parameters: `n`
object:The number of positions to shift the levels. A positive integer value will shift the levels to the right, and a negative integer value will shift the levels to the left.
Example:
Let’s say you have a categorical variable with levels representing different days of the week: “Monday”, “Tuesday”, “Wednesday”, “Thursday”, “Friday”, “Saturday”, and “Sunday”. However, the week in your dataset starts on Wednesday instead of Monday, and you want to shift the levels of the variable accordingly.
R
library(forcats)
days <- c("Monday", "Tuesday", "Wednesday", "Thursday", "Friday", "Saturday", "Sunday")
original_factor <- factor(c("Monday", "Tuesday", "Wednesday", "Thursday", "Friday", "Saturday", "Sunday"), levels = days)
shifted_factor <- fct_shift(original_factor, n = 2)
print(original_factor)
print(shifted_factor)
|
Output:
As you can see, the fct_shift() function has shifted the levels of the factor by 2 places, so the first level is now “Wednesday” instead of “Monday”, and the last level is now “Tuesday” instead of “Sunday”.
6. fct_count()
The fct_count() function in the forcats package in R allows you to count the number of occurrences of each level in a factor variable and returns a data frame with the counts and the levels.
Syntax:
Parameters: `f`
object:The factor variable to be counted.
Example:
Suppose you have a dataset that contains information about different types of flowers, including their colors. You want to create a summary of the dataset that shows the count of each flower color.
R
install.packages("dplyr")
|
R
library(dplyr)
library(forcats)
flowers <- data.frame(
type = c("Rose", "Lily", "Tulip", "Daisy", "Orchid", "Hydrangea", "Iris", "Peony", "Sunflower", "Poppy"),
color = c("Red", "White", "Yellow", "White", "Purple", "Blue", "Blue", "Pink", "Yellow", "Red")
)
color_counts <- flowers %>%
count(color = fct_infreq(color))
print(color_counts)
|
Output:
Explanation:
As you can see, the fct_count() function has counted the number of flowers for each color, and returned a new data frame with two columns: color, which contains the unique colors in the dataset, and n, which contains the count of each color.
Note that we’ve used the fct_infreq() function as an argument to the count() function to ensure that the colors are sorted by frequency of occurrence. If you don’t specify the order, the colors will be sorted alphabetically by default.
7. fct_lump()
The fct_lump() function in the forcats package in R allows you to group the least frequent levels of a factor variable into a new level called “other”.
Syntax:
Parameters: `f`
object:The factor variable to be lumped.
Syntax:
Parameters: `n`
object:The number of most frequent levels to keep.
Syntax:
Parameters: ‘other_level`
object:The name of the level to use for the “Other” category.
Example:
Suppose you have a dataset that contains information about different types of cars, including their colors. The color variable has many levels, but some of the levels have very few observations. You want to drop the levels with fewer than a certain number of observations to make the data more manageable.
R
library(dplyr)
library(forcats)
cars <- data.frame(
make = c("Toyota", "Honda", "Ford", "Chevrolet", "BMW", "Mercedes-Benz", "Audi", "Lexus", "Tesla", "Kia"),
color = c("Red", "White", "Silver", "Black", "White", "Black", "Blue", "Gray", "Red", "Yellow")
)
cars$color <- fct_lump(cars$color, n = 2)
print(unique(cars$color))
|
Output:
Explanation:
As you can see, the fct_lump() function has grouped the levels of the color variable that have fewer than 2 observations into a new level called “Other”. In this example, “Silver”, “Blue”, “Gray”, and “Yellow” were grouped into the “Other” level because they each appeared in only one observation. The resulting color variable now has four levels: “Red”, “White”, “Black”, and “Other”.
Note that we’ve used the n argument to specify the minimum number of observations that a level must have to be retained. In this example, we’ve specified a value of 2, which means that a level must have at least 2 observations to be retained. You can adjust the value of the n argument to suit your needs.
Share your thoughts in the comments
Please Login to comment...