Esquisse Package in R Programming
Last Updated :
08 Dec, 2021
Packages in the R programming are a collection of R functions, compiled code, and sample data. They are stored under a directory called “library” in the R environment. By default, R installs a set of packages during installation. One of the most important packages in R is the Esquisse package. Esquisse package helps to explore and visualize your data interactively. It is a Shiny gadget to create ggplot charts interactively with drag-and-drop to map your variables. One can quickly visualize the data accordingly to their type, export to ‘PNG’ or ‘PowerPoint’, and retrieve the code to reproduce the chart.
Installation
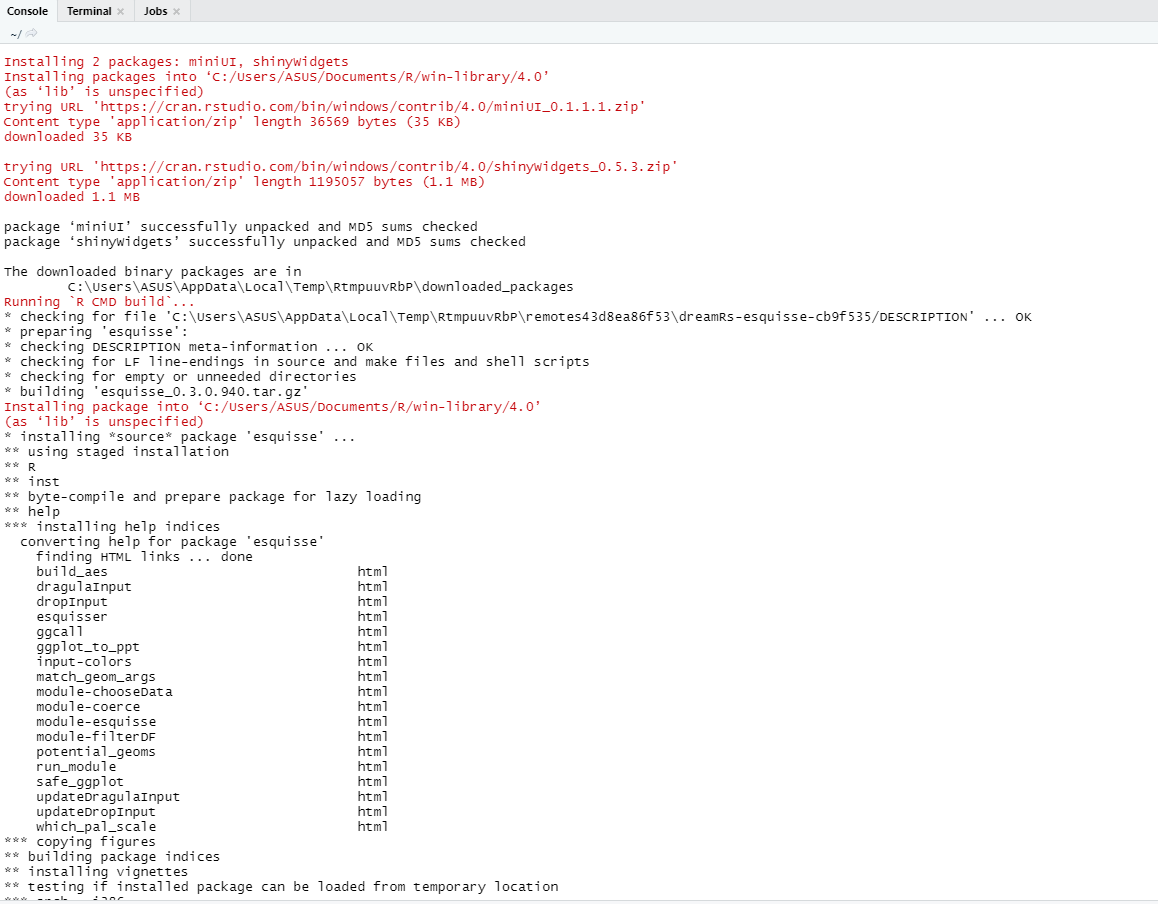
To use a package in R programming one must have to install the package first. This task can be done using the command install.packages(“packagename”).
source("https://install-github.me/dreamRs/esquisse")
install.packages("esquisse")
To install the development version from GitHub type this:
# or with devtools:
devtools::install_github("dreamRs/esquisse")
Important Verb Functions in Esquisse Package
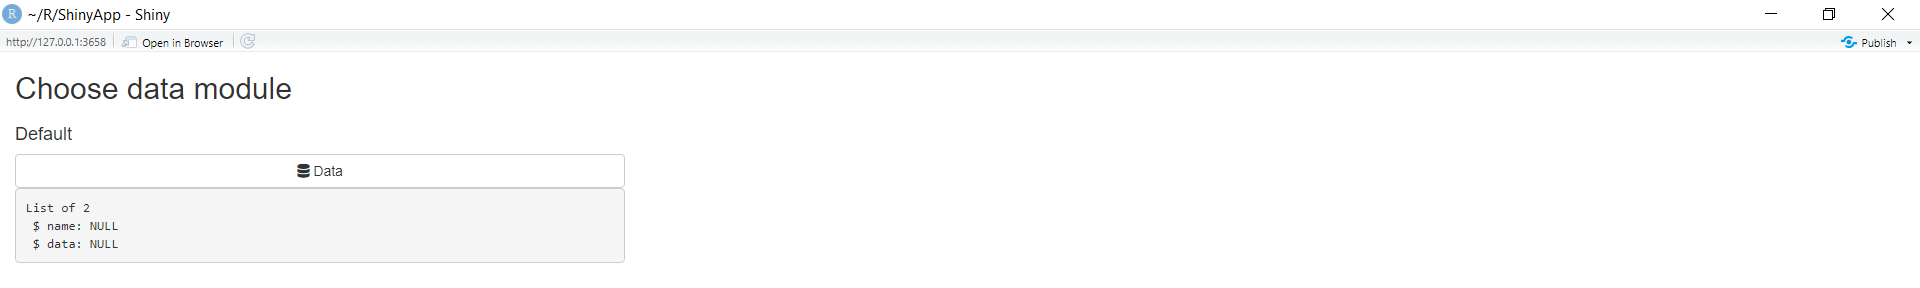
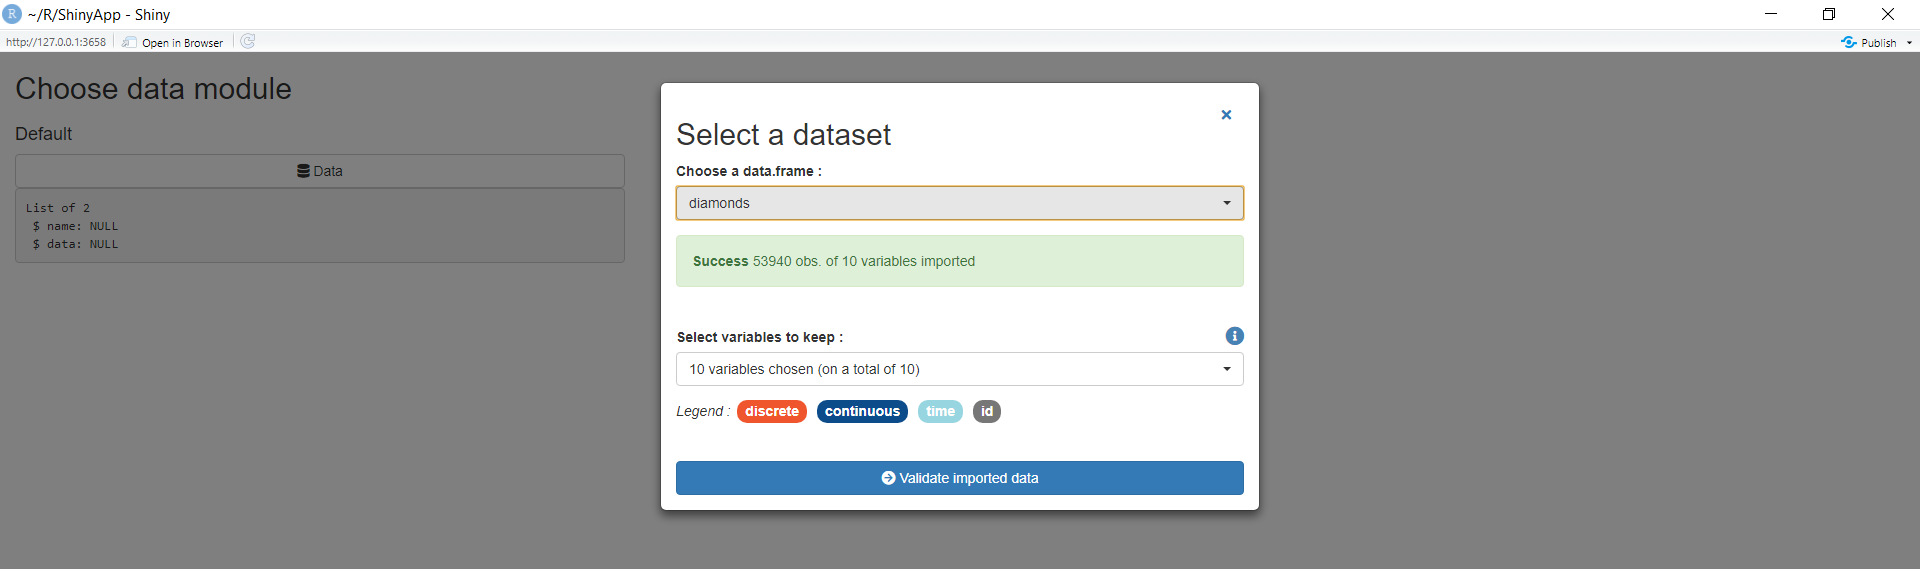
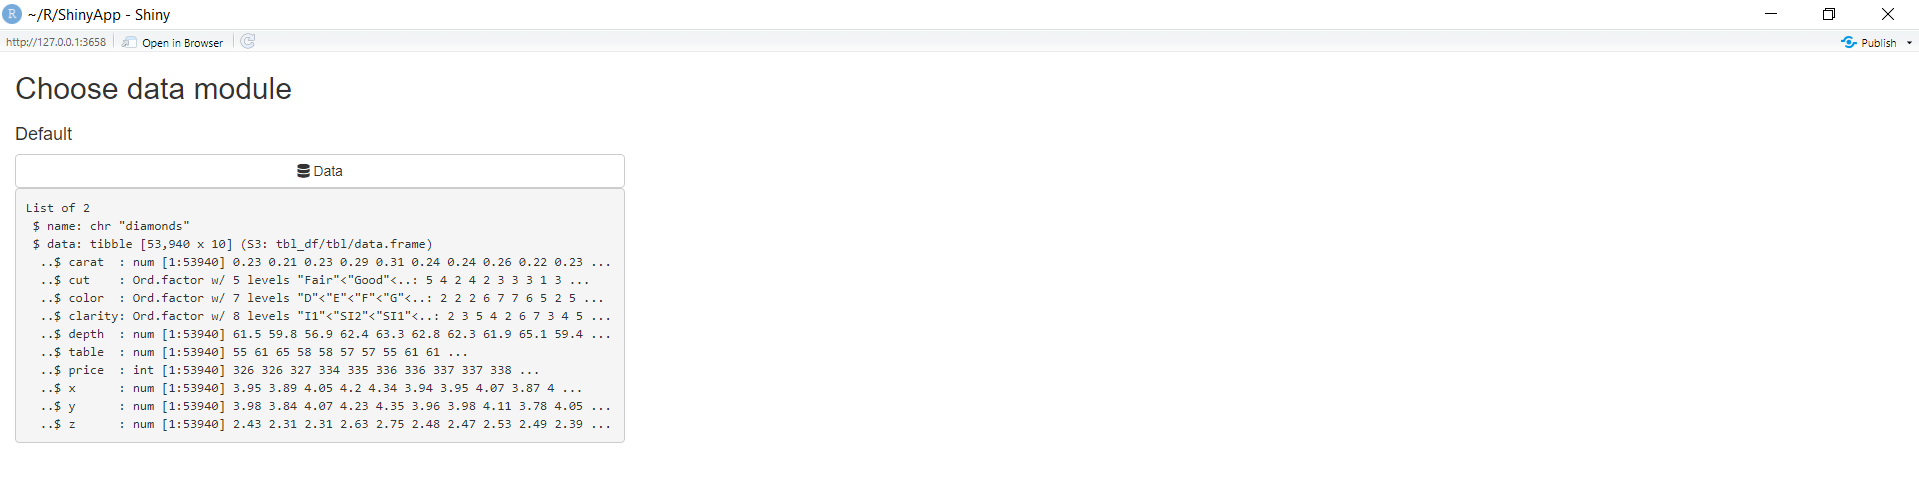
- chooseData-Module: It is a module for choosing data.frame from the user environment and select variable to use. It gives the user an option to choose from a given list of available datasets to work on within a shiny app.
Syntax:
chooseDataUI(id)
chooseDataServer(input, output, session, data = NULL, name = NULL,
selectVars = TRUE, launchOnStart = TRUE, defaultData = NULL)
|
Parameter
|
Description
|
| id |
Module’s id. |
| input |
Standard shiny input. |
| output |
Standard shiny output. |
| session |
Standard shiny session. |
| data |
data.frame to use by default. |
| name |
The name of data. |
| selectVars |
Logical (TRUE/FALSE), display menu to select vars to use in selected data.frame. |
| launchOnStart |
Launch modal when application is launched. |
| defaultData |
A character vector of data.frames to choose along if there
is no data.frames in Global environment.
By default, data.frames from ggplot2 are used.
|
Example:
R
library(shiny)
library(esquisse)
ui <- fluidPage(
tags$h2("Choose data module"),
fluidRow(
column(
width = 4, tags$h4("Default"),
chooseDataUI(id = "choose1"),
verbatimTextOutput(outputId = "res1"))))
server <- function(input, output, session)
{
res_dat1 <- callModule(
chooseDataServer, id = "choose1",
launchOnStart = FALSE)
output$res1 <- renderPrint({
str(reactiveValuesToList(res_dat1))})
}
shinyApp(ui,server)
|
Output:
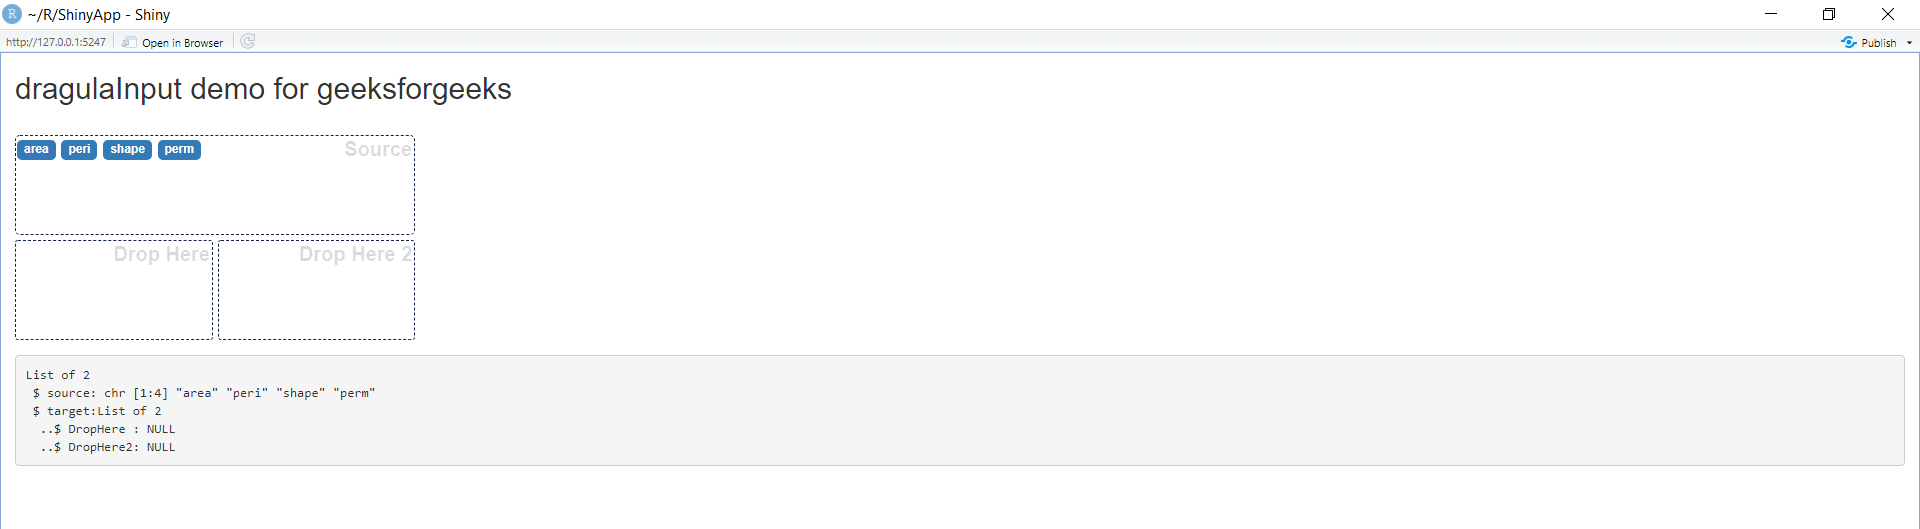
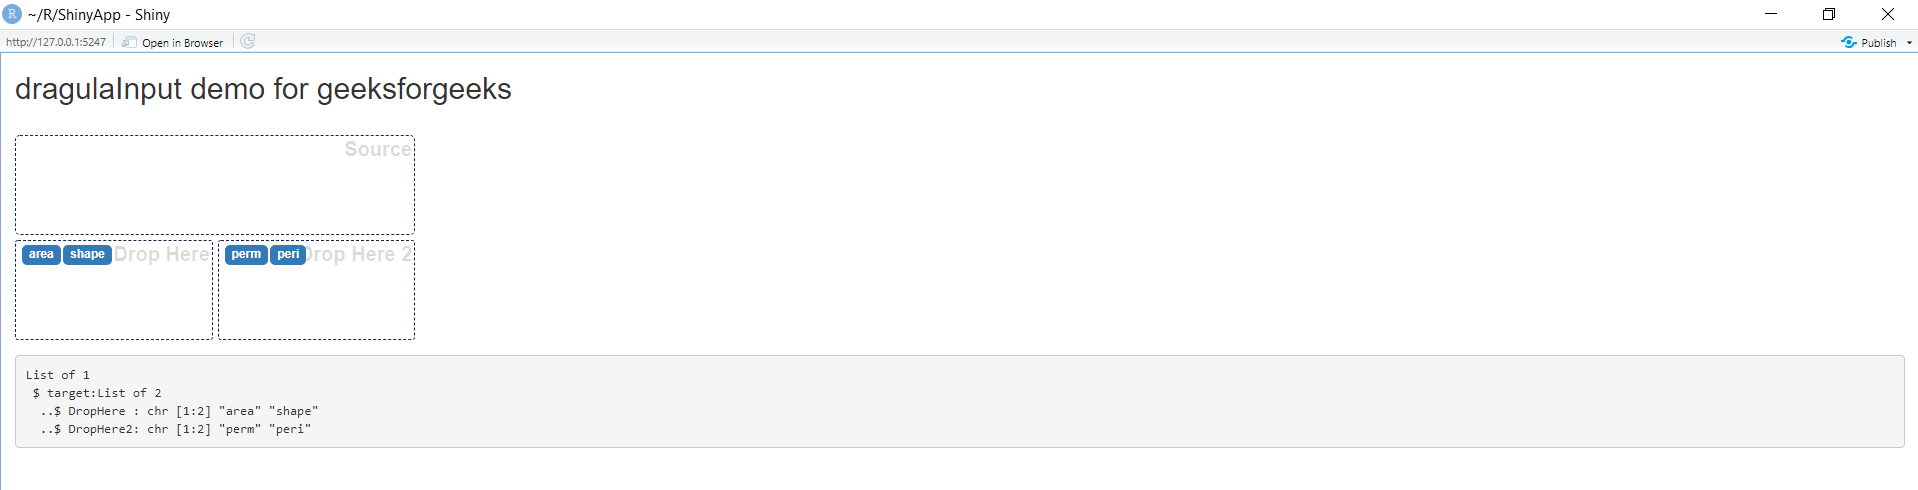
- dragulaInput: It creates a Drag And Drop Input Widget. One can select different labels(data) from a variety of labels provided by the developer to the app user to twerk with a simple drag and drop layouts.
Syntax: dragulaInput(inputId, sourceLabel, targetsLabels, targetsIds = NULL,
choices = NULL, choiceNames = NULL, choiceValues = NULL,
status = “primary”, replace = FALSE, badge = TRUE, width = NULL,
height = “200px”)
|
Parameter
|
Description
|
| inputId |
The input slot that will be used to access the value. |
| sourceLabel |
Label display in the source box. |
| targetsLabels |
Labels for each target element. |
| targetsIds |
Ids for retrieving values server-side. |
| choices |
List of values to select from. If this argument is provided,
then choiceNames and choiceValues must not be provided,
and vice-versa.
|
| choiceNames |
List of names and values, respectively, that are displayed
to the user in the app and correspond
to the each choice (for this reason, choiceNames and
choiceValues must have the same length).
|
| choiceValues |
List of names and values, respectively, that are displayed
to the user in the app and correspond
to the each choice (for this reason, choiceNames
and choiceValues must have the same length).
|
| status |
If choices are displayed into a Bootstrap label, you
can use Bootstrap status to color them, or NULL.
|
| replace |
When a choice is dragged in a target container already
containing a choice, does the later be replaced by the new one ?#’
|
| badge |
Displays choices inside a Bootstrap badge. |
| width |
Width of the input. |
| height |
Height of each boxes, the total input height is this parameter X 2. |
Example:
R
library("shiny")
library("esquisse")
ui <- fluidPage(
tags$h2("dragulaInput demo for geeksforgeeks"),
tags$br(),
dragulaInput(
inputId = "data_di", sourceLabel = "Source",
targetsLabels = c("Drop Here", "Drop Here 2"),
choices = names(rock), width = "400px"),
verbatimTextOutput(outputId = "result"))
server <- function(input, output, session)
{
output$result <- renderPrint(str(input$data_di))
}
shinyApp(ui = ui, server = server)
|
Output:
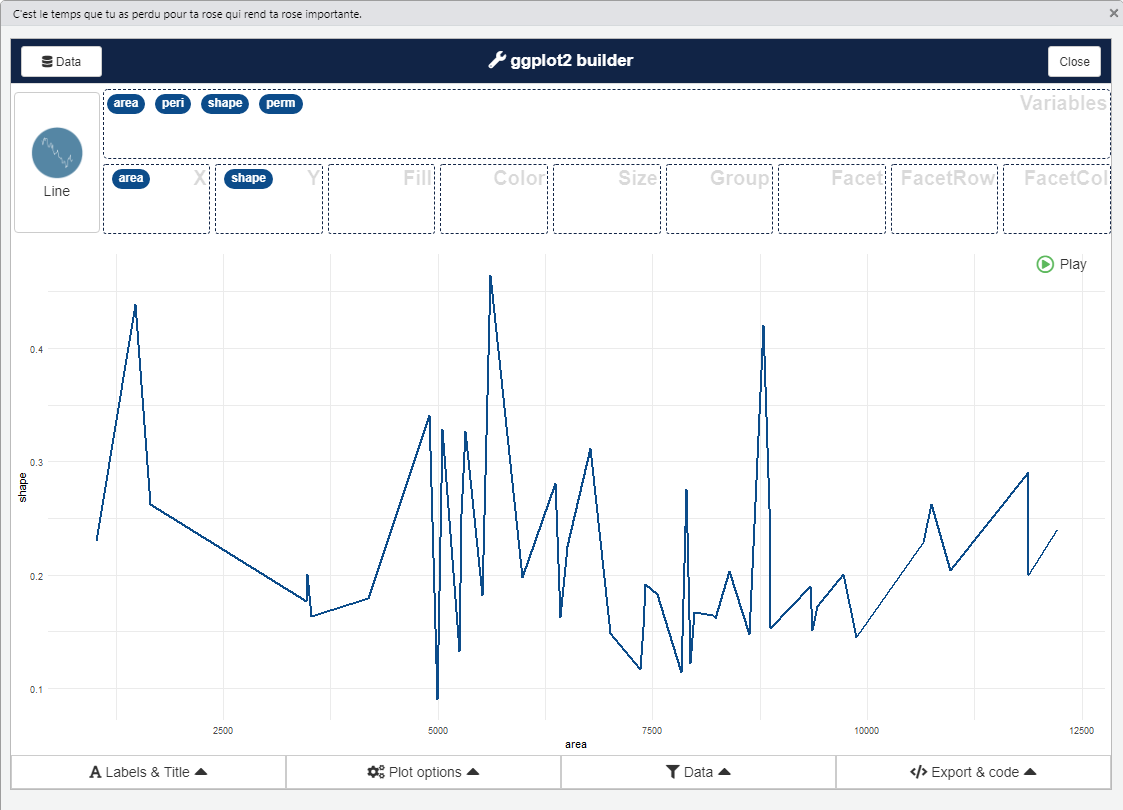
- esquisser: It is an add-in to easily create plots with ggplot2. ggplot2 is a system for declaratively creating graphics. Just provide the data, tell ggplot2 how to map variables to aesthetics, what graphical primitives to use, and it takes handles rest all on its own.
Syntax: esquisser(data = NULL)
|
Parameter
|
Description
|
| data |
A data.frame. |
Example:
R
library("shiny")
library("esquisse")
esquisser(rock)
|
Output:
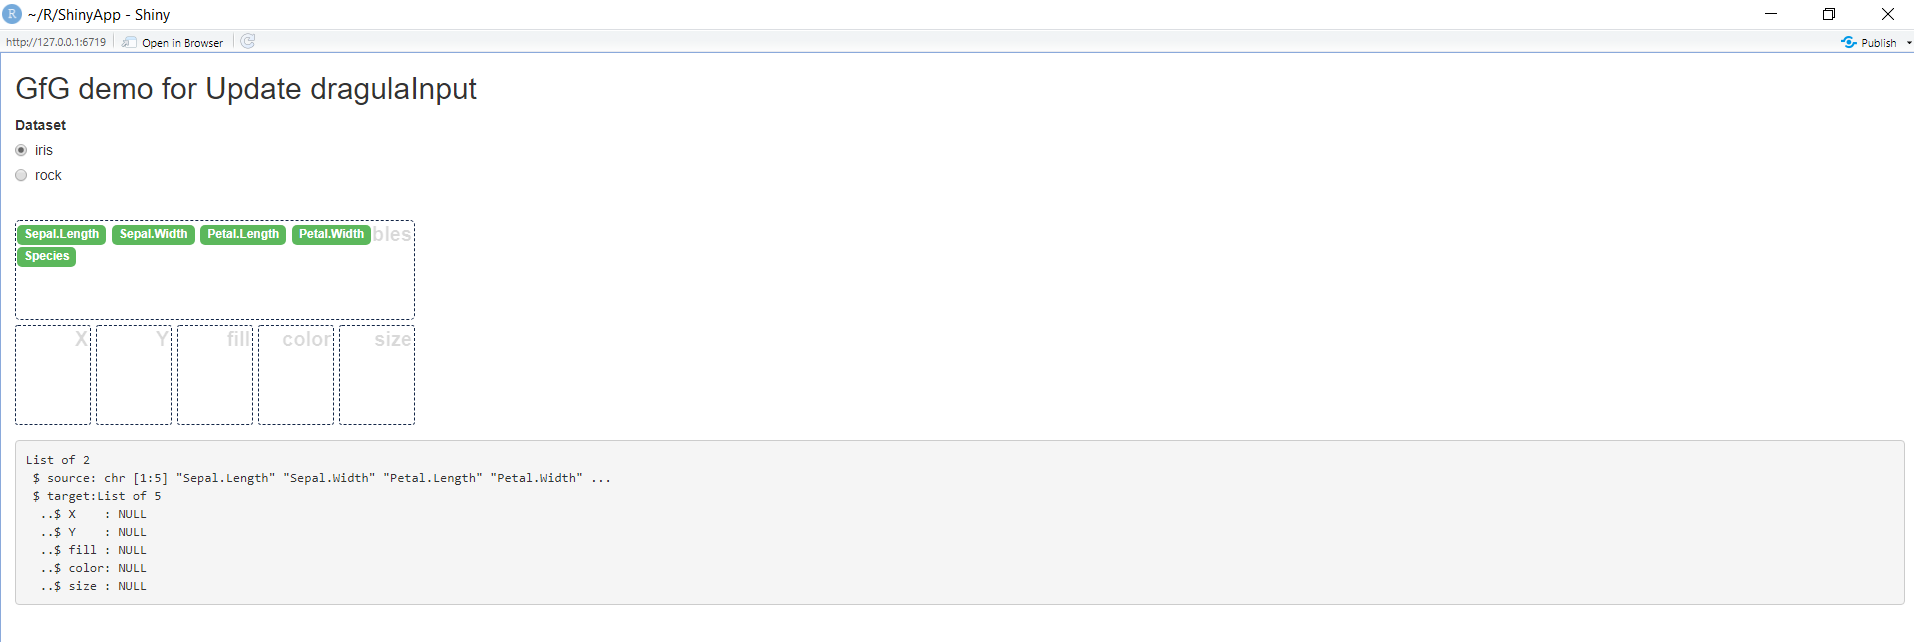
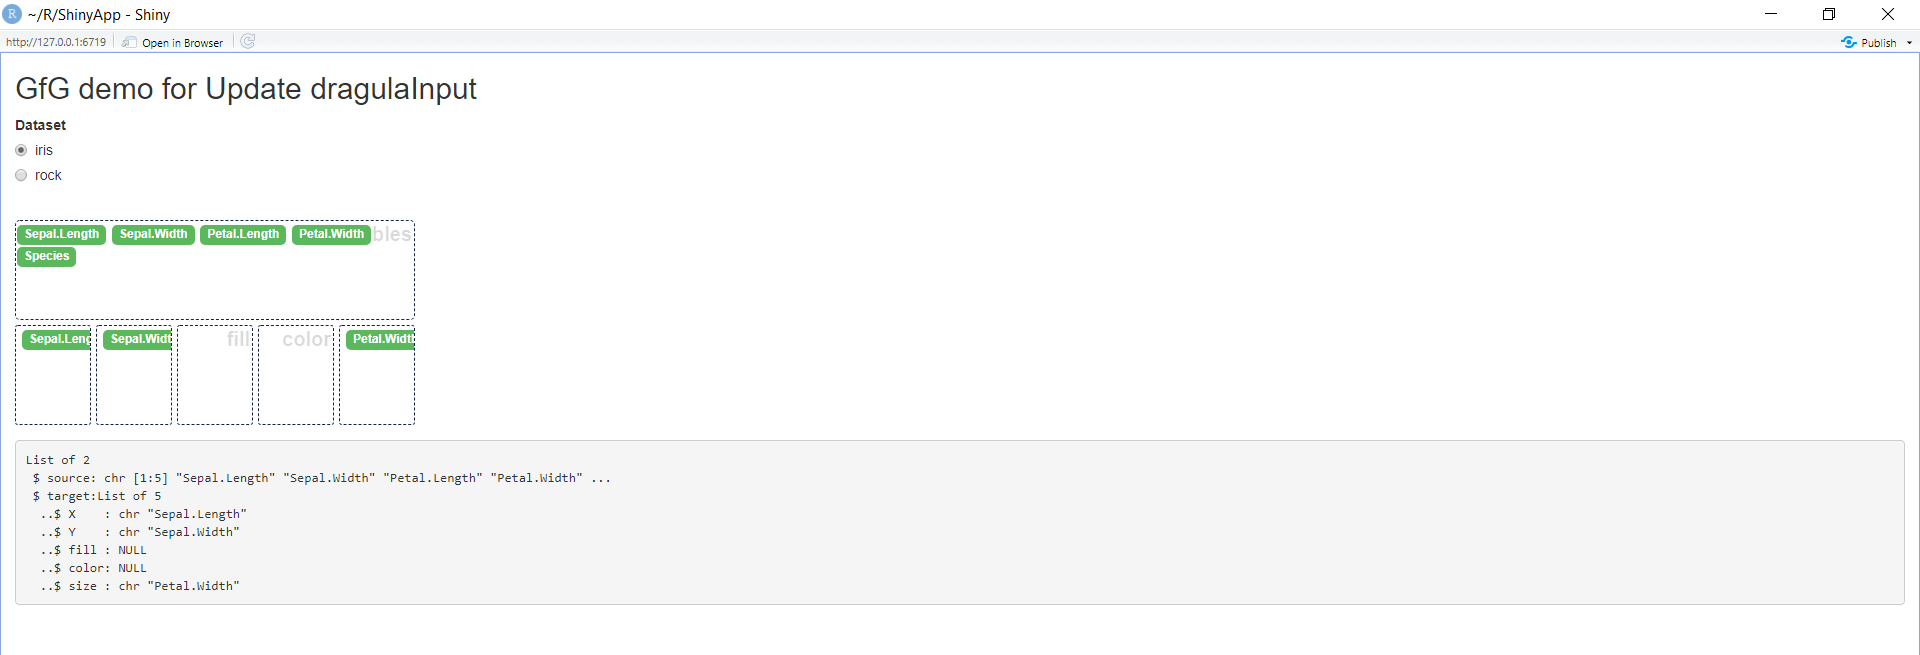
- updateDragulaInput: Update Dragula Input. It updates the drag and drop widgets as soon as the call is passed to the function. For instance, if a label is dragged and dropped from the input, the function updates the set of provided input values in the output.
Syntax: updateDragulaInput(session, inputId, choices = NULL, choiceNames = NULL,
choiceValues = NULL, badge = TRUE, status = “primary”)
|
Parameter
|
Description
|
| session |
The session object passed to function given to shinyServer. |
| inputId |
The id of the input object. |
| choice |
List of values to select from. If this argument is provided, then choiceNames
and choiceValues must not be provided, and vice-versa
|
|
choiceNames
choiceValues
|
List of names and values, respectively, that are displayed to the user in the app and correspond
to the each choice (for this reason, choiceNames and choiceValues must have the same length).
If either of these arguments is provided, then the other must be provided and choices must not be provided.
|
| badge |
Displays choices inside a Bootstrap badge. |
| status |
If choices are displayed into a Bootstrap badge, you can use Bootstrap status to color them, or NULL. |
Example:
R
library("shiny")
library("esquisse")
ui <- fluidPage(
tags$h2("GfG demo for Update dragulaInput"),
radioButtons(
inputId = "update", label = "Dataset",
choices = c("iris", "rock")),
tags$br(),
dragulaInput(
inputId = "data", sourceLabel = "Variables",
targetsLabels = c("X", "Y", "fill", "color", "size"),
choices = names(iris), replace = TRUE,
width = "400px", status = "success"),
verbatimTextOutput(outputId = "result"))
server <- function(input, output, session)
{
output$result <- renderPrint(str(input$data))
observeEvent(input$update, {
if (input$update == "iris")
{
updateDragulaInput(
session = session, inputId = "data",
choices = names(iris), status = "success")
}
else
{
updateDragulaInput(
session = session, inputId = "data",
choices = names(rock))
}
}, ignoreInit = TRUE)
}
shinyApp(ui, server)
|
Output:
- ggplot_to_plot: Utility To Export ggplot Objects To PowerPoint. This utility function provides an easy way to save graphs and models layed using ggplot to a .ppt file or simply a PowerPoint presentation.
Syntax: ggplot_to_ppt(gg = NULL)
|
Parameter
|
Description
|
| gg |
character. Name(s) of ggplot object(s), if NULL, launch the Shiny gadget. |
Example:
R
library(ggplot2)
p <- ggplot(iris) +
geom_point(aes(Sepal.Length, Sepal.Width))
ggplot_to_ppt("p")
|
Output:
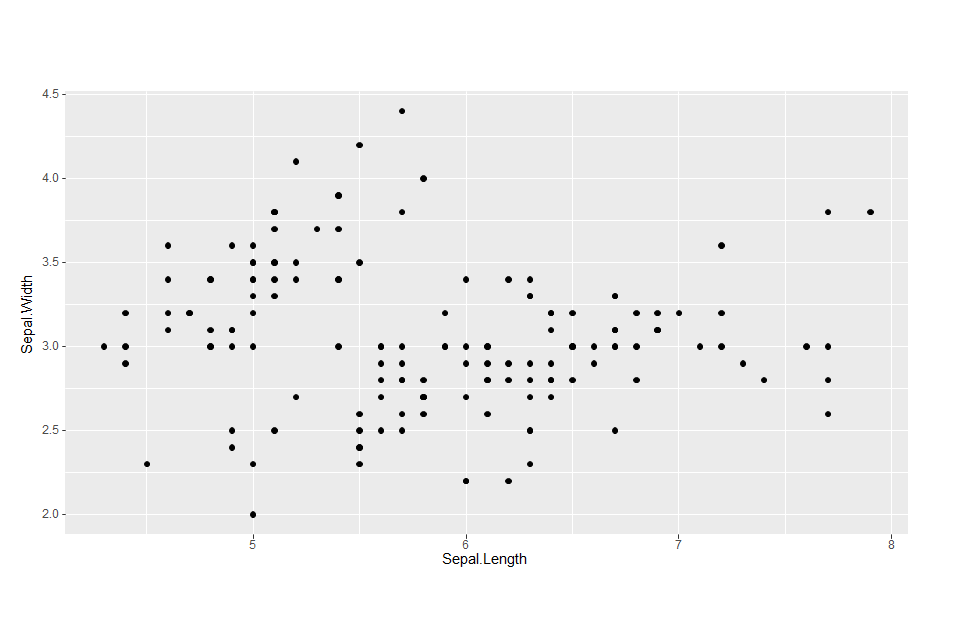
The code displays the output in a ppt format. Output to the above piece of code can be seen via this link.
Like Article
Suggest improvement
Share your thoughts in the comments
Please Login to comment...