Console Tab in Google Chrome Browser
Last Updated :
07 Nov, 2023
The console tab in Chrome, from a developer’s perspective, is a crucial tool for debugging web applications. It allows the developer to view and interact with JavaScript errors, and log messages, and run code snippets directly in the browser. Developers can inspect variables, test functions, and diagnose issues in real-time, making it an essential component of web development and allowing the debugging of a JavaScript file very efficiently.
Benefits of the Console Tab
- Easier Debugging: The console tab offers easier debugging for JavaScript files by logging all the errors, warnings, and variables that you might have logged into the code.
- Error Handling: If a JavaScript file throws an error, then it is printed to the console tab automatically by the JavaScript engine. It also specifies the JavaScirpt file (in the case of multiple files), the line number, and the type of error thrown.
- Logging: The developer can print some data into the console through the console.log() function in JavaScript; this is pretty useful for debugging purposes and viewing the content of variables at specific lines in the file.
Steps to open the Console Tab
- From Shortcut: Press “Ctrl + Shift + i” to directly open the developer tools, and then switch to the console tab.
- From the toolbar, right-click on the three dots at the end of the toolbar, click More Tools, then click Developer Tools, and then switch to the console tab.
- From the main screen, right-click on the main screen, then click inspect to open the developer tools, and then switch to the console tab.
.png)
Various option available in Console Tab
All features of the console tab are explained below:
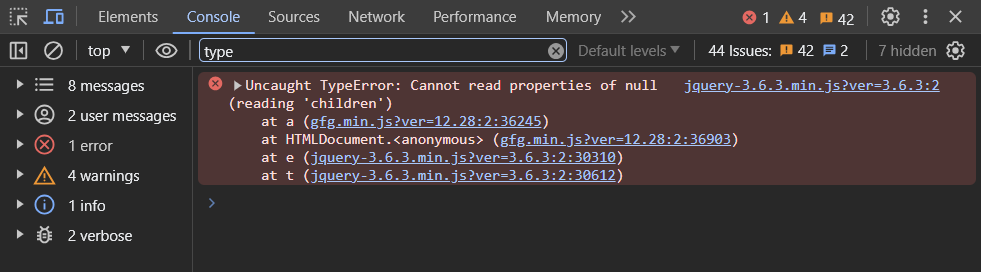
- Editor: This is the space of the console tab the user can use to view errors and warnings of the running javascript files. Users can use this space to run custom JavaScript commands to practice. This tab also logs variables that the user might have instructed the javascript file to print to the console tab.
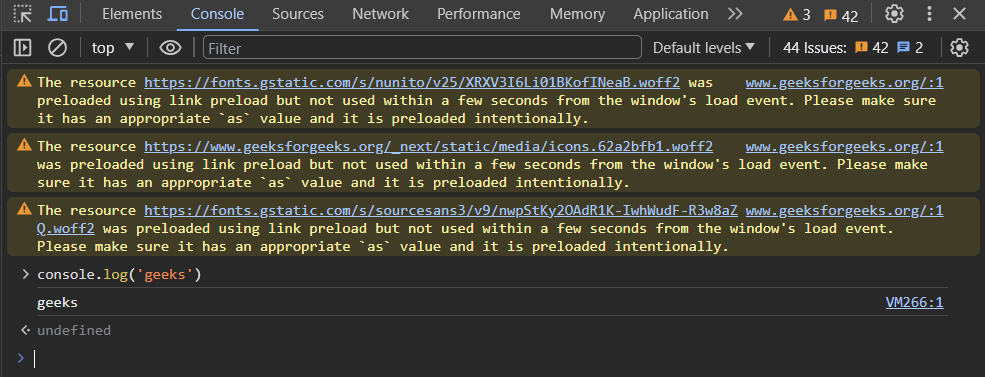
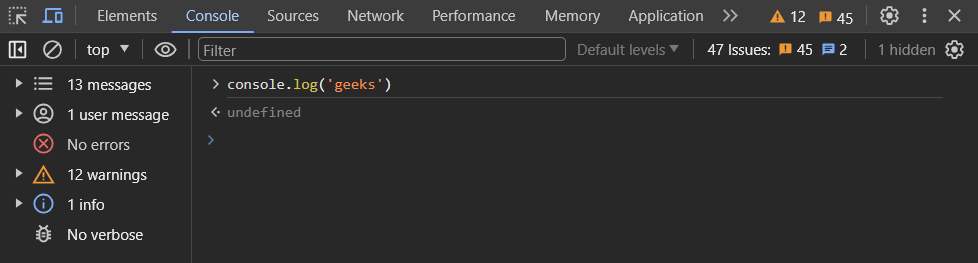
- Console sidebar: Users can view detailed information on errors, warnings, messages, and other important information of the running javascript. This sidebar mainly conveys useful information to the user.
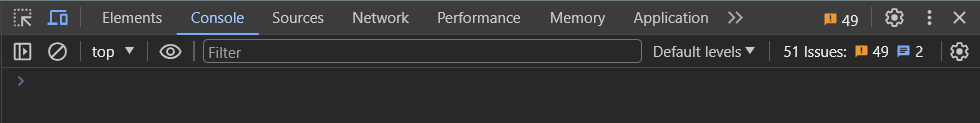
- Clear console button: Users can clear the editor tab by clicking this button
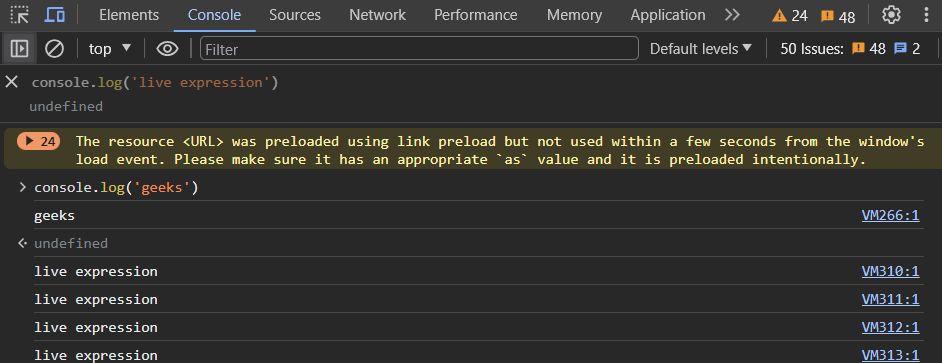
- Live Expression: Users can create live running javascript using this feature, just click on the eye button and write down the javascript code, and hit enter to see it running infinitely.
- Filter search bar: Use this to filter out messages, errors, and warnings from the editor space of the console tab. This is particularly useful when you need to find out specific information logged in the editor.
The console tool is used to view all errors, warnings, and logs of the javascript file of the website. More uses can be:
- Accessing all resources: You can use the Network panel to see how the web page loads different resources, such as images, scripts, stylesheets, fonts, etc. You can also see the size, type, status, and timing of each resource.
- Viewing the DOM: You can use the Elements panel to see the HTML and CSS code of any web page and how they are structured in a tree-like view. You can also edit the code and see the changes instantly on the web page.
- Debugging JavaScript: You can use the DOM Breakpoints feature in the Elements panel to pause the execution of the code when a certain element is modified, added, or removed. This can help you to debug and test dynamic web pages that change their content frequently.
- Performance of the website: You can use the Performance panel to record and analyze the activity of your web page over time. You can see how much time is spent on loading, scripting, rendering, painting, etc. You can also identify bottlenecks and optimize your code for better performance.
Example showing Usage of Console Tab
Follow the below steps to use the console tab on the geeksforgeeks website:
Step1: Using Chrome web browser open the Geeks for Geeks website
Step2 : Press “Ctrl + Shift + i “
Step3: Select the console tab to view all logged errors of the website
Step4: Now view the DOM and try debugging the error
.gif) Conclusion
Conclusion
The Console tab in Chrome is a versatile, multifunctional tool that empowers developers to debug, experiment, and fine-tune web applications. It’s not just a window into errors; it’s a gateway to understanding and improving the code.
Share your thoughts in the comments
Please Login to comment...