Memory Tab in Google Chrome Browser
Last Updated :
16 Nov, 2023
Developers may find out how much memory a web page uses by using the Memory tab in Google Chrome’s Developer Tools. It offers a thorough overview of memory-related information, including specifics on DOM nodes, event listeners, JavaScript memory usage, and more. This tool helps developers detect memory leaks, inefficient memory utilization, and wasteful resource usage, all of which improve the stability and speed of online applications.
Features of Memory Tab
- Snapshot Comparison: The “Take Snapshot” option on the Memory tab allows developers to capture and compare snapshots of an application’s memory usage in different states. This helps identify the source of memory-related issues with the web page by enabling the detection of memory usage, leaks, or modifications in between snapshots.
- Dedicated Heap Profiler: A dedicated heap profiler is available in Chrome’s Memory tab, which assists with complicated memory analysis, displays JavaScript heap allocations, and keeps track of objects and functions that use memory. Developers can analyze the memory use of particular objects to optimize memory utilization.
- Garbage Collection Insights: By displaying information about the memory schedule and use of the JavaScript engine, it offers insights into garbage collection events. This feature helps developers better understand memory management and modify their code to reduce memory overhead and improve the performance of web applications.
Benefits of Memory Tab
- Memory Leak Detection: By utilizing the Memory tab to identify and trace memory leaks, developers can pinpoint areas where resources are not being released appropriately. This helps to fix memory leaks and enhances the general stability and speed of web applications. Developers may ensure optimal resource management and prevent excessive memory usage and application crashes by identifying memory leaks and ensuring memory is allocated and released in an efficient manner.
- DOM Node Analysis: By closely inspecting the Document Object Model (DOM) nodes via the Memory tab, developers may assess how much memory each node uses. This feature makes it possible to optimize the DOM structure, which boosts the effectiveness of the application. It facilitates the tracking of DOM node-connected event listeners.
- JavaScript Memory Usage Evaluation: Developers may examine which areas of the code utilize a lot of memory by using the tab’s JavaScript memory allocation feature. This information is critical for optimizing code and developing more efficient and optimized programs since it helps discover memory-intensive routines or variables. Code can be optimized by developers to consume less memory and possibly improve the overall efficiency of the application, which will make it more responsive.
Steps to open the Memory Tab:
Method 1: Right-click on an active Chrome tab screen and click on inspect, developer tools will open up, now click on memory.
Method 2:
- Right-click on three dots at the end of the Chrome toolbar
- Click on more tools
- Click on developer tools
- Click on memory
Method 3: Press ctrl + shift + i to open up the developer tools, then click on memory to access the memory tab.
-(2).gif)
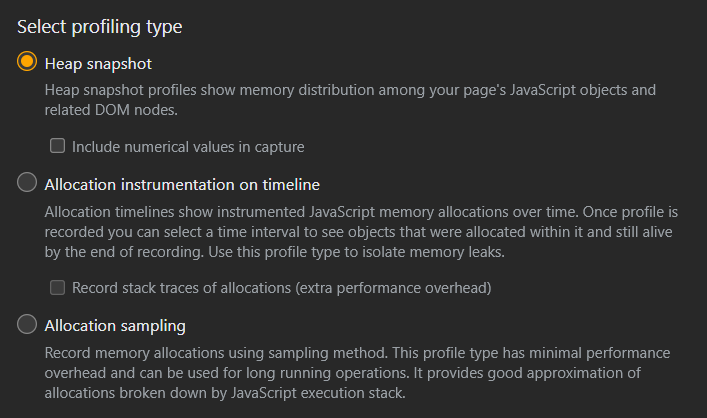
Various types of memory profiling types available in the memory tab
There are three types of memory profiling available in the memory tab:
- Heap snapshot: Heap snapshot profiles show memory among your page’s javascript objects and related DOM nodes.
- Allocation instrumentation on timeline: Allocation timelines show instrumented Javascript memory allocations over time. Once profiles are recorded you can select a time interval to see objects that were allocated within it and still alive by the end of recording. This specializes in identifying memory leaks.
- Allocation sampling: Record memory allocations using the sampling method. This profile type has minimal performance overhead and can be used for long-running operations. It provides a good approximation of allocations broken down by the JavaScript execution stack.

Example showing usage of memory tab
Understanding memory allocation and changes over time within a web application can be tracked with the help of snapshots found in the Memory tab of the Chrome Developer Tools. They provide a means of capturing the heap’s (memory space’s) state at particular times while the program is running. This example shows how to capture screenshots of memory usage and analyze them further:
Step 1: Open the memory tab (in the developer console) by simply pressing Ctrl + Shift + i
Step 2: In select profiling type, choose the first option Heap snapshot
Step 3: Click on the Take Snapshot button (it will take some time to gather information)
Step 4: Now in the tab you will see a list of all memory-using applications associated with the web page and the browser, click on any of them to reveal more detailed information about each process.
.gif)
Conclusion
The Memory tab in the Developer Tools of Google Chrome is an essential tool for developers who want to make their applications faster. By providing details of memory usage, it gives developers the ability to detect and fix memory leaks, inefficient resource use, and problems with JavaScript memory allocation. This tool helps in the development of more reliable, effective, and responsive web apps, resulting in an enhanced user experience across a variety of online platforms, thanks to its extensive data and analysis.
Share your thoughts in the comments
Please Login to comment...