Network Tab in Google Chrome Browser
Last Updated :
08 Nov, 2023
Google Chrome has many tools and techniques that allow us to watch and analyze our Internet activity and how our data is processed over the internet. The Network tab is one of the available tools inside Google Chrome. It gives us various options by which we can diagnose and debug our internet data, which is going through our internet. It does not matter whether it is going through Wi-Fi or using an Ethernet cable. Sometimes our internet is not working in the Chrome browser. This may happen because of a network tab misconfiguration. The network tab in Google Chrome can also be used for our local-level development, and it is widely used by developers because when we develop web applications, there is a need to test whether they are working perfectly or not and how the server is responding to the client side when clients try to fetch and find our services.
Benefits of using the Network Tab in Chrome
Following are some important benefits of the Network tab in Chrome.
- The Network Tab in Google Chrome can be used for our system performance optimization by solving any issue that arises during real-time internet use.
- As a user, we can also use it for resource analysis, meaning how much of our data and other resources are being consumed. It can also show how many requests and responses are coming and going from the source to the destination.
- The network tab can also be used in cases where we are facing network errors, so the network tab can show which requests have failed and why they failed. It provides us with all the details related to specific requests.
- The network tab in Google Chrome records all the HTTP requests, so if we want to see how our request is going to the server and what type of HTTP version and our user agent are being shared with the server, we can see all this information in the network tab in Chrome.
- We can also manage and differentiate our cookies, which we use to interact with servers and web pages.
Steps to open the network tab
Step 1: Open a new tab in google chrome.
.png)
Step 2: Open any web page. For testing purpose we are opening the geeksforgeeks webpage. You can open anyone.
-(1).png)
Step 3: Now Click on the right button in mouse and select the inspect function and open the source code element
-(1).png)
Step 4: After opening the source code element, the right side third function is a network tab so click on the Network tab and open the network tab.
.png)
By the above methods we can simply find out and open the Network tab in chrome. After Opening the Network tab we can start to perform our Task what we want to do with Network Tab.
Features and Usage Examples of network tab in chrome
1. Third Party requests:
This option is used when we want to see about the third party requests , meaning which type of request and how these requests are made through our System when we visit any Web page. For Understanding in better way let’s see following Example-
Step 1: Open the geekforgeek.org in google chrome and click right to your mouse and select inspect element and open the console screen.
Step 2: Using the network tab we can see what Third party requests have been made with our system when we visit any Specific Webpage. As in our case we used a GFG web page so you can also see about all third party requests which were made by our browser backend when we visited the GFG Web page..png)
2. Headers:
HTTP Request Response Headers play important roles. By Using the network tab option we can see headers of our visiting web page. For Understanding in better way let’s see following Example-
Step 1: Open the geekforgeek.org in google chrome and click right to your mouse and select inspect element and open the console screen
Step 2: Headers option basically used for finding out headers information like what is Request URL, and what Request method is used and also status code. There may be other information also based on which type of webpage we are visiting. In our case we used GFG Web page so you can see both the data Request and Response along with Header information of our request..png)
3. Blocked requests:
Network tab in chrome provides an option to block any request which is being used by our browsers. Lets see Example is there any blocked request in our browser or not .
Step 1: open the geekforgeek.org in google chrome and click right to your mouse and select inspect element and open the console screen
Step 2: In our case there are no blocked requests. We can list out all the requests which are blocked using this option.
.png) 4. Filter:
4. Filter:
As the name suggests this is used for filtering any specific type of data inside the chrome browser under network tab category. Lets see how a example how it works –
Step 1 – open the geekforgeek.org in google chrome and click right to your mouse and select inspect element and open the console screen
Step 2: Based upon the property like Request and response we can filter our data which is being sent when we visit any webpage.
.png) 5. Preview:
5. Preview:
Preview is an option which is used to see the files inside the network tab. file can be Java Script files which are being executed by our browser or any other files such as image, video. For Understanding in better way let’s see a Example –
Step 1: Open the geekforgeek.org in google chrome and click right to your mouse and select inspect element and open the console screen
Step 2: In our case we are seeing a preview of a Java Script file , you can see based upon your selection . This can be very useful when we want to see how the specific file has code which is being executed by our browser.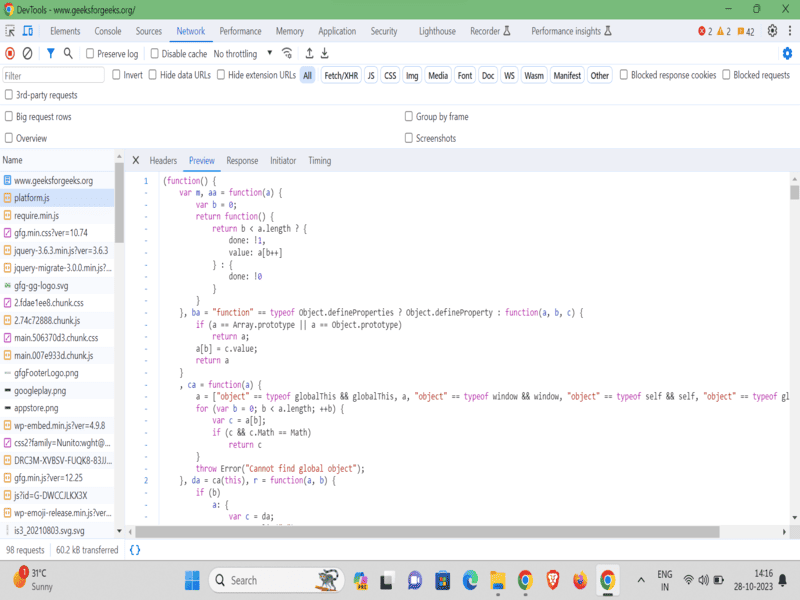
Conclusion:
Google Chrome has many facilities for browser users and as well as for developers to utilise it and work efficiently , Network tab is one of them which allows for users and developers for checking the network activity when they visit any specific URL . They can also do some special work like seeing the preview of Script through chrome itself and seeing full request and full response . There is one interesting feature which is filtering the data, users can filter the data means if they want to see only requests and responses , they can apply filters and list down all requests and responses which are made through the browser and web server. There are many other facilities which can be used for understanding the network behaviour between server and client side.
Share your thoughts in the comments
Please Login to comment...