Question 1. Form the pair of linear equations in the following problems, and find their solutions graphically.
(i) 10 students of Class X took part in a Mathematics quiz. If the number of girls is 4 more than the number of boys, find the number of boys and girls who took part in the quiz.
Solution:
Let’s take,
Number of girls = x
Number of boys = y
According to the given conditions,
x + y = 10 -(1)
x – y = 4 -(2)
So, to construct a graph, we need to find at least two solutions of the given equation.
For equation (1)
x + y = 10, So, we can use the following table to draw the graph:
For equation (2)
x – y = 4, So, we can use the following table to draw the graph:
The graph will be as follows for Equation (1) and (2):
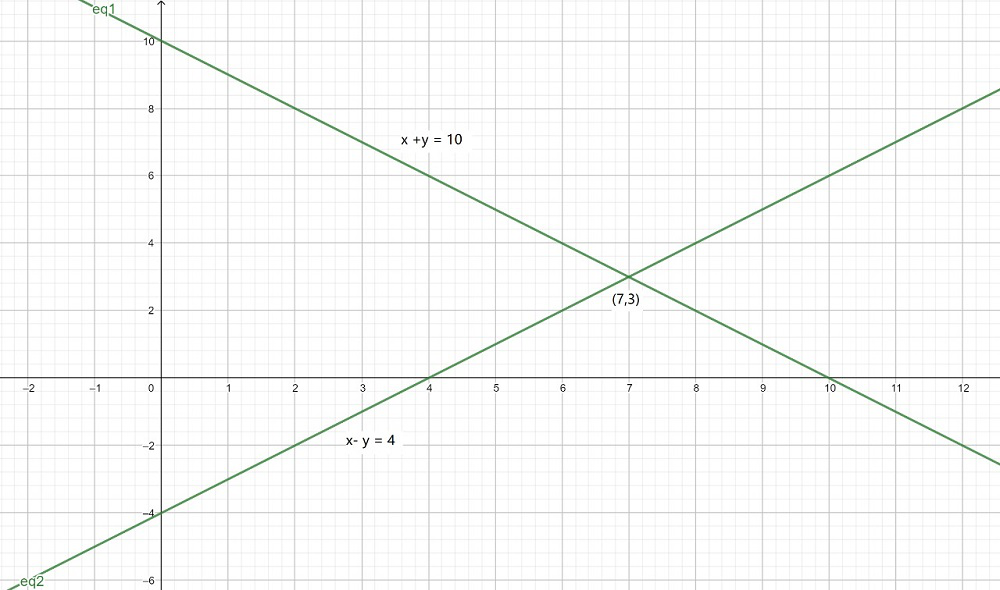
Now, from the graph, we can conclude the given lines intersect each other at point (7, 3).
Hence, the number of girls are 7 and number of boys are 3 in a class.
(ii) 5 pencils and 7 pens together cost ₹ 50, whereas 7 pencils and 5 pens together cost ₹ 46. Find the cost of one pencil and that of one pen.
Solution:
Let’s take,
Cost for one pencil = x
Cost for one pencil = y
According to the given conditions,
5x + 7y = 50 -(1)
7x + 5y = 46 -(2)
So, to construct a graph, we need to find at least two solutions of the given equation.
For equation (1)
5x + 7y = 50, So, we can use the following table to draw the graph:
For equation (2)
7x + 5y = 46, So, we can use the following table to draw the graph:
The graph will be as follows for Equation (1) and (2):
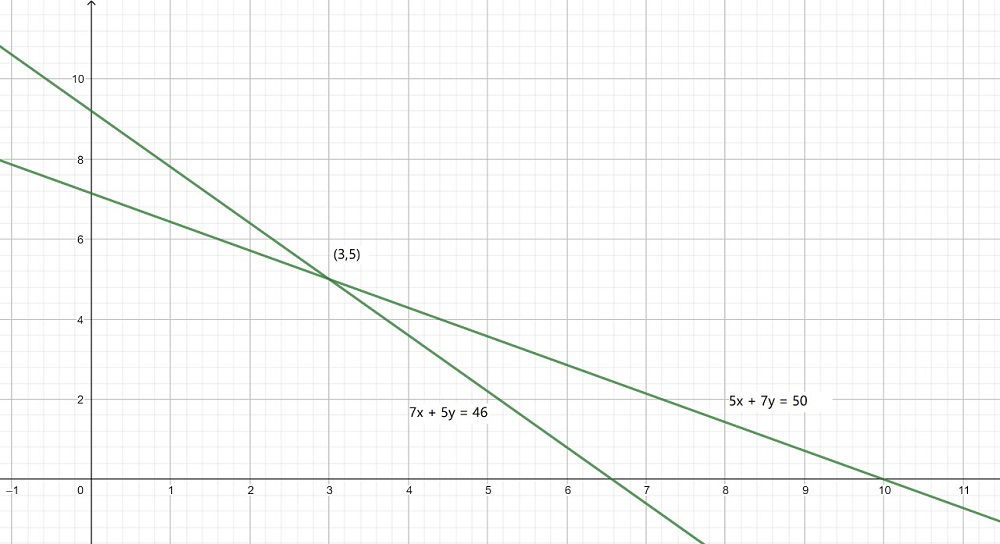
Now, from the graph, we can conclude the given lines intersect each other at point (3, 5).
Hence, the cost of a pencil is ₹ 3 and cost of a pen is ₹ 5.
Question 2. On comparing the ratios [Tex]\frac{a1}{a2}, \frac{b1}{b2} [/Tex], and [Tex]\frac{c1}{c2} [/Tex], find out whether the lines representing the following pairs of linear equations intersect at a point, are parallel or coincident:
(i) 5x – 4y + 8 = 0; 7x + 6y – 9 = 0
Solution:
In the given equations,
a1 = 5
a2 = 7
b1 = -4
b2 = 6
c1 = 8
c2 = -9
Now, here
a1/a2 = 5/7
b1/b2 = -4/6 = -2/3
c1/c2 = 8/-9
As, here
[Tex]\frac{a1}{a2} ≠ \frac{b1}{b2} [/Tex]
Hence, the given pairs of equations have a unique solution and the lines intersect each other at exactly one point.
(ii) 9x + 3y + 12 = 0; 18x + 6y + 24 = 0
Solution:
In the given equations,
a1 = 9
a2 = 18
b1 = 3
b2 = 6
c1 = 12
c2 = 24
Now, here
a1/a2 = 9/18 = 1/2
b1/b2 = 3/6 = 1/2
c1/c2 = 12/24 = 1/2
As, here
[Tex]\frac{a1}{a2} = \frac{b1}{b2} = \frac{c1}{c2} [/Tex]
Hence, the given pairs of equations have infinite many solutions and the lines are coincident.
(iii) 6x – 3y + 10 = 0; 2x – y + 9 = 0
Solution:
In the given equations,
a1 = 6
a2 = 2
b1 = -3
b2 = -1
c1 = 10
c2 = 9
Now, here
a1/a2 = 6/2 = 3
b1/b2 = -3/-1 = 3
c1/c2 = 10/9
As, here
[Tex]\frac{a1}{a2} = \frac{b1}{b2} ≠ \frac{c1}{c2} [/Tex]
Hence, the given pairs of equations have no solution and the lines are parallel and never intersect each other.
Question 3. On comparing the ratios [Tex]\frac{a1}{a2}, \frac{b1}{b2} [/Tex], and [Tex]\frac{c1}{c2} [/Tex], find out whether the following pair of linear equations are consistent, or inconsistent.
(i) 3x + 2y = 5; 2x – 3y = 7
Solution:
In the given equations,
a1 = 3
a2 = 2
b1 = 2
b2 = -3
c1 = -5
c2 = -7
Now, here
a1/a2 = 3/2
b1/b2 = 2/-3
c1/c2 = -5/-7
As, here
[Tex]\frac{a1}{a2} ≠ \frac{b1}{b2}[/Tex]
Hence, the given pairs of equations have a unique solution and the lines intersect each other at exactly one point.
Pair of linear equations are CONSISTENT.
(ii) 2x – 3y = 8; 4x – 6y = 9
Solution:
In the given equations,
a1 = 2
a2 = 4
b1 = -3
b2 = -6
c1 = -8
c2 = -9
Now, here
a1/a2 = 2/4 = 1/2
b1/b2 = -3/-6 = 1/2
c1/c2 = -8/-9 = 8/9
As, here
[Tex]\frac{a1}{a2} = \frac{b1}{b2} ≠ \frac{c1}{c2} [/Tex]
Hence, the given pairs of equations have no solution and the lines are parallel and never intersect each other.
Pair of linear equations are INCONSISTENT.
(iii) [Tex]\frac{3}{2}x + \frac{5}{3}y [/Tex] = 7; 9x – 10y = 14
Solution:
In the given equations,
a1 = 3/2
a2 = 9
b1 = 5/3
b2 = -10
c1 = -7
c2 = -14
Now, here
[Tex]\frac{a1}{a2} = \frac{\frac{3}{2}}{9} = \frac{1}{6}[/Tex]
[Tex]\frac{b1}{b2} = \frac{\frac{5}{3}}{-10} = \frac{-1}{6}[/Tex]
c1/c2 = -7/-14 = 1/2
As, here
[Tex]\frac{a1}{a2} ≠ \frac{b1}{b2}[/Tex]
Hence, the given pairs of equations have a unique solution and the lines intersect each other at exactly one point.
Pair of linear equations are CONSISTENT.
(iv) 5x – 3y = 11; – 10x + 6y = –22
Solution:
In the given equations,
a1 = 5
a2 = -10
b1 = -3
b2 = 6
c1 = -11
c2 = 22
Now, here
a1/a2 = 5/-10 = -1/2
b1/b2 = -3/6 = -1/2
c1/c2 = -11/22 = -1/2
As, here
[Tex]\frac{a1}{a2} = \frac{b1}{b2} = \frac{c1}{c2} [/Tex]
Hence, the given pairs of equations have infinite many solutions and the lines are coincident.
Pair of linear equations are CONSISTENT.
(v) [Tex]\frac{4}{3}x [/Tex] + 2y = 8; 2x + 3y = 12
Solution:
In the given equations,
a1 = 4/3
a2 = 2
b1 = 2
b2 = 3
c1 = -8
c2 = -12
Now, here
[Tex]\frac{a1}{a2} = \frac{\frac{4}{3} }{2} = \frac{2}{3}[/Tex]
b1/b2 = 2/3
c1/c2 = -8/-12 = 2/3
As, here
[Tex]\frac{a1}{a2} = \frac{b1}{b2} = \frac{c1}{c2} [/Tex]
Hence, the given pairs of equations have infinite many solutions and the lines are coincident.
Pair of linear equations are CONSISTENT.
Question 4. Which of the following pairs of linear equations are consistent/inconsistent? If consistent, obtain the solution graphically:
(i) x + y = 5, 2x + 2y = 10
Solution:
In the given equations,
a1 = 1
a2 = 2
b1 = 1
b2 = 2
c1 = -5
c2 = -10
Now, here
a1/a2 = 1/2
b1/b2 = 1/2
c1/c2 = -5/-10 = 1/2
As, here
[Tex]\frac{a1}{a2} = \frac{b1}{b2} = \frac{c1}{c2} [/Tex]
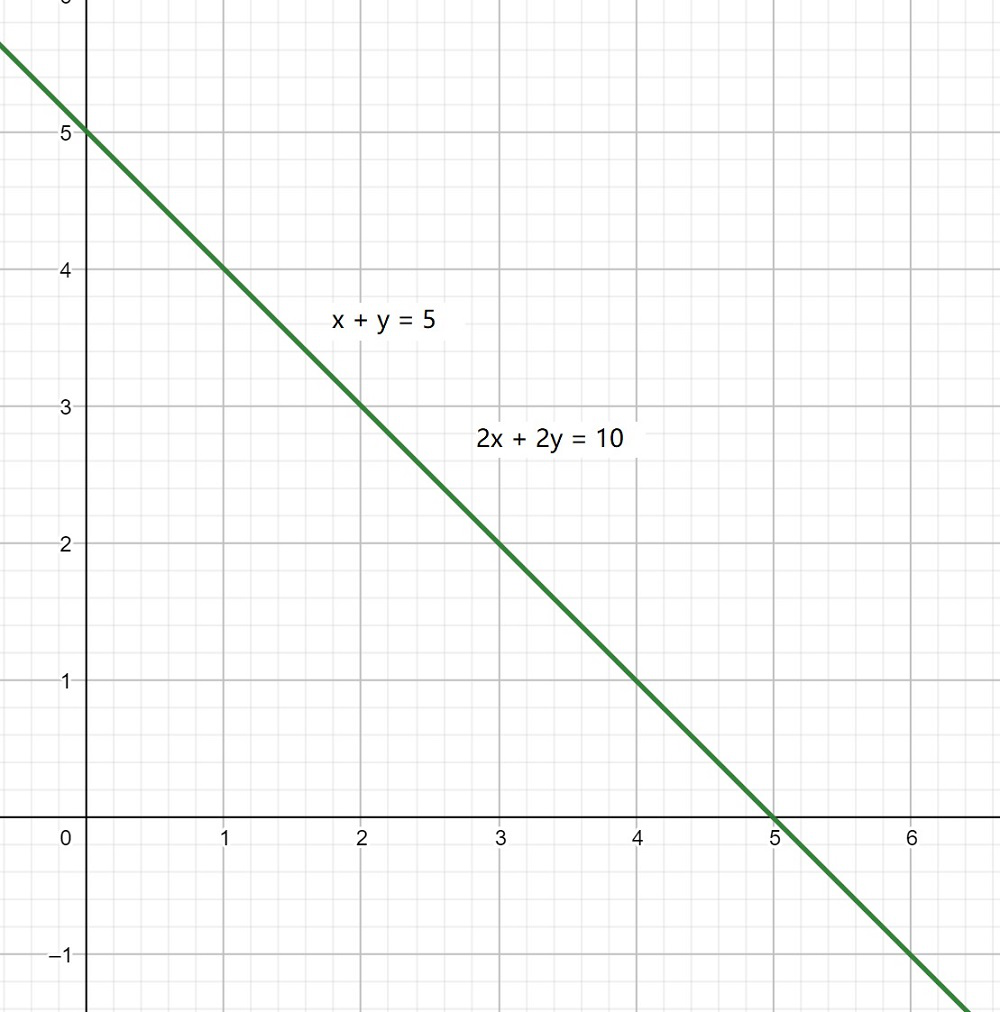
Hence, the given pairs of equations have infinite many solutions and the lines are coincident.
Pair of linear equations are CONSISTENT.
x + y = 5 -(1)
2x + 2y = 10 -(2)
So, to construct a graph, we need to find at least two solutions of the given equation.
For equation (1)
x + y = 5, So, we can use the following table to draw the graph:
For equation (2)
2x + 2y = 10, So, we can use the following table to draw the graph:
The graph will be as follows for Equation (1) and (2):
(ii) x – y = 8, 3x – 3y = 16
Solution:
In the given equations,
a1 = 1
a2 = 3
b1 = -1
b2 = -3
c1 = -8
c2 = -16
Now, here
a1/a2 = 1/3
b1/b2 = 1/3
c1/c2 = -8/-16 = 1/2
As, here
[Tex]\frac{a1}{a2} = \frac{b1}{b2} ≠ \frac{c1}{c2} [/Tex]
Hence, the given pairs of equations have no solution and the lines are parallel and never intersect each other.
Pair of linear equations are INCONSISTENT.
(iii) 2x + y – 6 = 0, 4x – 2y – 4 = 0
Solution:
In the given equations,
a1 = 2
a2 = 4
b1 = 1
b2 = -2
c1 = -6
c2 = -4
Now, here
a1/a2 = 2/4 = 1/2
b1/b2 = 1/-2
c1/c2 = -6/-4 = 3/2
As, here
[Tex]\frac{a1}{a2} ≠ \frac{b1}{b2}[/Tex]
Hence, the given pairs of equations have a unique solution and the lines intersect each other at exactly one point.
Pair of linear equations are CONSISTENT.
2x + y – 6 = 0 -(1)
4x – 2y – 4 = 0 -(2)
So, to construct a graph, we need to find at least two solutions of the given equation.
For equation (1)
2x + y – 6 = 0, So, we can use the following table to draw the graph:
For equation (2)
4x – 2y – 4 = 0, So, we can use the following table to draw the graph:
The graph will be as follows for Equation (1) and (2):
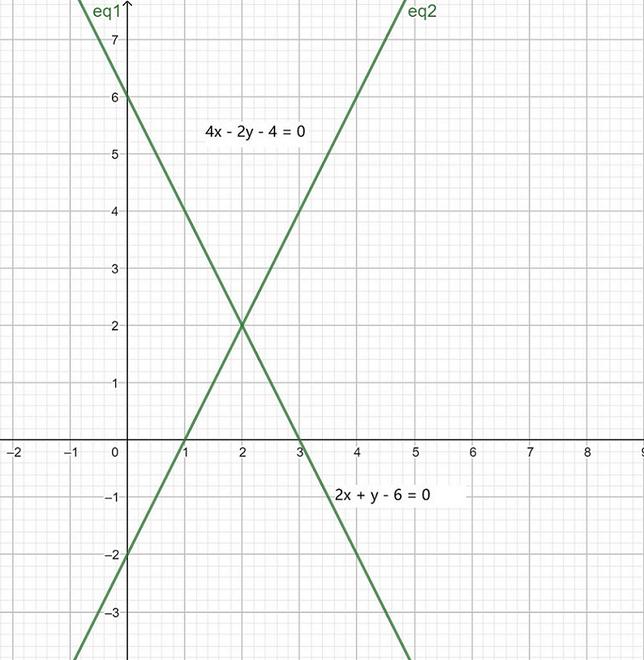
Now, from the graph, we can conclude the given lines intersect each other at point (2, 2).
(iv) 2x – 2y – 2 = 0, 4x – 4y – 5 = 0
Solution:
In the given equations,
a1 = 2
a2 = 4
b1 = -2
b2 = -4
c1 = -2
c2 = -5
Now, here
a1/a2 = 2/4 = 1/2
b1/b2 = -2/-4 = 1/2
c1/c2 = -2/-5 = 2/5
As, here
[Tex]\frac{a1}{a2} = \frac{b1}{b2} ≠ \frac{c1}{c2} [/Tex]
Hence, the given pairs of equations have no solution and the lines are parallel and never intersect each other.
Pair of linear equations are INCONSISTENT.
Question 5. Half the perimeter of a rectangular garden, whose length is 4 m more than its width, is 36 m. Find the dimensions of the garden.
Solution:
Let’s take,
length = x
breadth = y
Half the perimeter of a rectangular garden = [Tex]\frac{2(x+y)}{2} [/Tex] = x + y
According to the given conditions,
x = y + 4 -(1)
x + y = 36 -(2)
So, to construct a graph, we need to find at least two solutions of the given equation.
For equation (1)
x = y + 4, So, we can use the following table to draw the graph:
For equation (2)
x + y = 36, So, we can use the following table to draw the graph:
The graph will be as follows for Equation (1) and (2):
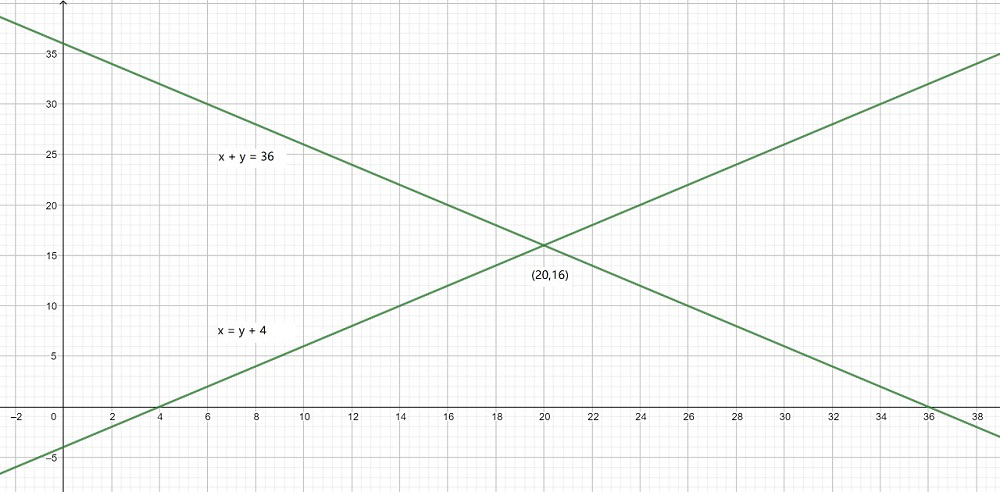
Now, from the graph, we can conclude the given lines intersect each other at point (20, 16).
Hence, length is 20 m and breadth is 16 m of rectangle.
Question 6. Given the linear equation 2x + 3y – 8 = 0, write another linear equation in two variables such that the geometrical representation of the pair so formed is:
(i) intersecting lines
Solution:
Linear equation in two variables such that pair so formed is intersecting lines, so it should satisfy the given conditions
[Tex]\frac{a1}{a2} ≠ \frac{b1}{b2}[/Tex]
By rearranging, we get
[Tex]\frac{a1}{b1} ≠ \frac{a2}{b2}[/Tex]
Hence, the required equation should not be in ratio of 2/3
Hence, another equation can be 2x – 9y + 9 = 0
where the ratio is 2/-9
and, [Tex]\frac{2}{3} ≠ \frac{2}{-9}[/Tex]
(ii) parallel lines
Solution:
Linear equation in two variables such that pair so formed is parallel lines, so it should satisfy the given conditions
[Tex]\frac{a1}{a2} = \frac{b1}{b2} ≠ \frac{c1}{c2}[/Tex]
By rearranging, we get
[Tex]\frac{a1}{b1} = \frac{a2}{b2}[/Tex]
[Tex]\frac{b1}{c1} ≠ \frac{b2}{c2}[/Tex]
Hence, the required equation a2/b2 should be in ratio of 2/3 and b2/c2 should not be equal to 3/-8
Hence, another equation can be 4x + 6y + 9 = 0
where the ratio a2/b2 is 2/3
and,[Tex] \frac{b2}{c2} ≠ \frac{3}{-8}[/Tex]
(iii) coincident lines
Solution:
Linear equation in two variables such that pair so formed is parallel lines, so it should satisfy the given conditions
[Tex]\frac{a1}{a2} = \frac{b1}{b2} = \frac{c1}{c2}[/Tex]
By rearranging, we get
[Tex]\frac{a1}{b1} = \frac{a2}{b2}[/Tex]
[Tex]\frac{b1}{c1} = \frac{b2}{c2}[/Tex]
Hence, the required equation a2/b2 should be in ratio of 2/3 and b2/c2 should be equal to 3/-8
Hence, another equation can be 4x + 6y -16 = 0
where the ratio a2/b2 is 2/3
and, b2/c2 = 3/-8
Question 7. Draw the graphs of the equations x – y + 1 = 0 and 3x + 2y – 12 = 0. Determine the coordinates of the vertices of the triangle formed by these lines and the x-axis, and shade the triangular region.
Solution:
x – y + 1 = 0 -(1)
3x + 2y – 12 = 0 -(2)
So, to construct a graph, we need to find at least two solutions of the given equation.
For equation (1)
x – y + 1 = 0, So, we can use the following table to draw the graph:
For equation (2)
3x + 2y – 12 = 0, So, we can use the following table to draw the graph:
The graph will be as follows for Equation (1) and (2):
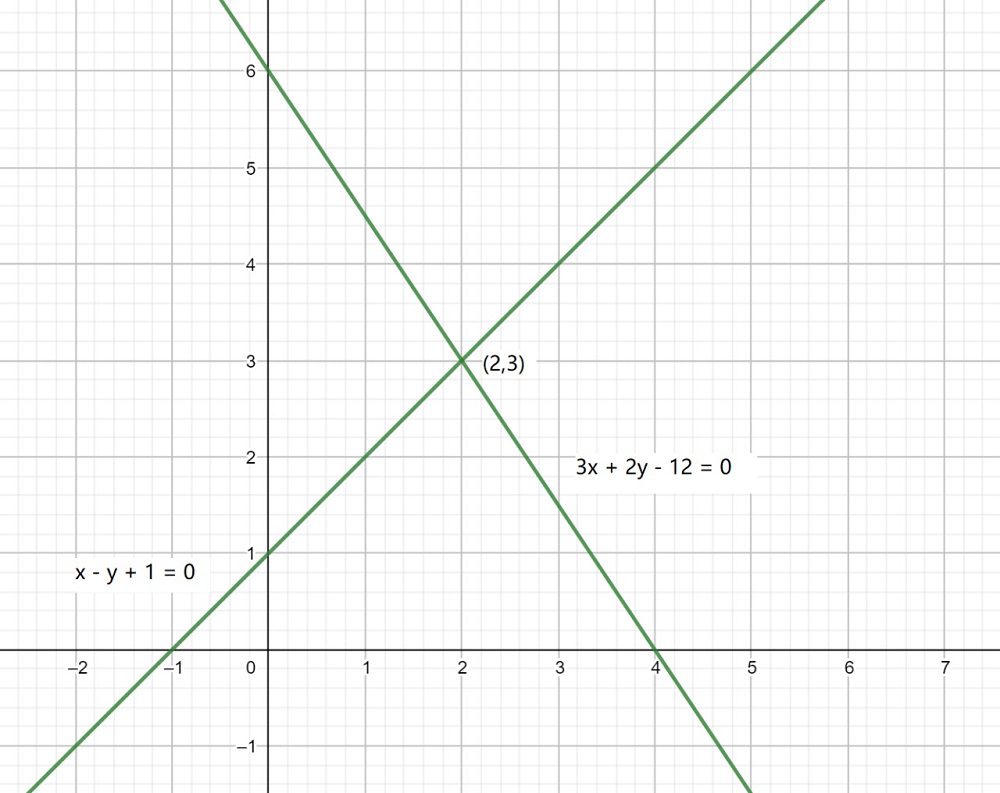
Now, from the graph, we can conclude the given lines intersect each other at point (2, 3), and x-axis at (−1, 0) and (4, 0).
Hence, the vertices of the triangle are (2, 3), (−1, 0), and (4, 0).
Share your thoughts in the comments
Please Login to comment...