Change Labels of GGPLOT2 Facet Plot in R
Last Updated :
30 Jun, 2021
In this article, we will see How To Change Labels of ggplot2 Facet Plot in R Programming language.
To create a ggplot2 plot, we have to load ggplot2 package. library() function is used for that. Then either create or load dataframe. Create a regular plot with facets. The labels are added by default.
Example:
R
library("ggplot2")
DF <- data.frame(X = rnorm(20),
Y = rnorm(20),
LBLs = c("Label 1", "Label 2",
"Label 3", "Label 4"))
ggplot(DF, aes(X, Y)) +
geom_point(size = 7, fill = "green", color = "black", shape = 21) +
facet_grid(. ~ LBLs)
|
Output :
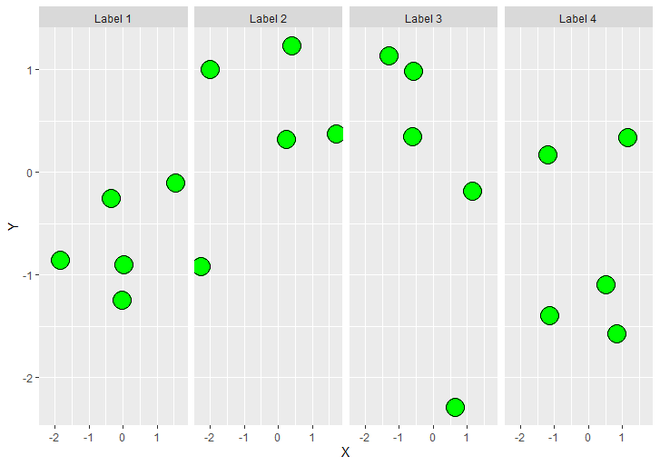
FacetPlot using ggplot2
Now let us explore different approaches to change the labels.
Method 1: Combine Label Variable with Facet Labels
If we want to combine Label Variable (LBLs) to Facet Labels (Values of LBLs), then for that we simply have to use labeller parameter of facet_grid() and set label_both to its value.
Example 1:
R
library("ggplot2")
DF <- data.frame(X = rnorm(20),
Y = rnorm(20),
LBLs = c("Label 1", "Label 2",
"Label 3", "Label 4"))
ggplot(DF, aes(X, Y)) +
geom_point(size = 7, fill = "green", color = "black", shape = 21) +
facet_grid(. ~ LBLs, labeller = label_both)
|
Output :

Combine Label Variable with Facet Labels
Method 2: Using levels()
As we discussed previously the LBLs variable of DataFrame is responsible for Labels of Facet, so now we will create a new DataFrame and assign old DataFrame DF to it. Then simply change the Values of Labels variable of the new DataFrame. Here we use levels() function to set the attribute of a variable in a new manner.
Syntax : levels(x) <- value
Parameter :
- x : A Data Object eg. Vector.
- Value : Named List specifying how to rename the levels.
Return : Set (Rename) the value of vector.
Example 2:
R
library("ggplot2")
DF <- data.frame(X = rnorm(20),
Y = rnorm(20),
LBLs = c("Label 1", "Label 2",
"Label 3", "Label 4"))
newDF <- DF
levels(newDF$LBLs) <- c("New Label 1", "New Label 2",
"New Label 3", "New Label 4")
ggplot(newDF, aes(X, Y)) +
geom_point(size = 7, fill = "green", color = "black", shape = 21) +
facet_grid(. ~ levels(LBLs))
|
Output :

Changed Facet Labels using levels()
Method 3: Using labeller parameter
The labeller can be a function, or it can be a named character vector (i.e. parameter), which can take either value or variable. labeller() function, when assigned to labeller parameter of facet_grid(), takes named arguments of the form ‘variable = value’ and changes the labels manually.
Example 3:
R
library("ggplot2")
DF <- data.frame(X = rnorm(20),
Y = rnorm(20),
LBLs = c("Label 1", "Label 2",
"Label 3", "Label 4"))
new <- c("labeller 1", "labeller 2",
"labeller 3", "labeller 4")
names(new) <- c("Label 1", "Label 2",
"Label 3", "Label 4")
ggplot(DF, aes(X, Y)) +
geom_point(size = 7, fill = "green", color = "black", shape = 21) +
facet_grid(. ~ LBLs, labeller = labeller(LBLs = new))
|
Output:

Changed Facet Labels using labeller
Share your thoughts in the comments
Please Login to comment...