Remove Labels from ggplot2 Facet Plot in R
Last Updated :
24 Oct, 2021
In this article, we will discuss how to remove the labels from the facet plot in ggplot2 in the R Programming language.
Facet plots, where one subsets the data based on a categorical variable and makes a series of similar plots with the same scale. We can easily plot a facetted plot using the facet_wrap() function of the ggplot2 package. When we use facet_wrap() in ggplot2, by default it gives a title to each plot according to the group they are divided into.
Syntax:
plot + facet_wrap( ~facet-variable)
Parameter:
- facet-variable: Determines the variable around which plots have to be divided.
Here, is a basic facet plot made using the diamonds data frame which is provided by R Language natively. We have used the facet_wrap() function with ~clarity to divide the plot into facets according to their clarity.
Example: Basic plot
R
library(ggridges)
library(tidyverse)
ggplot(diamonds, aes(x=price, y=color, fill=color)) +
geom_density_ridges()+
facet_wrap(~cut)
|
Output:

Remove labels from Facet plot
We can customize various aspects of a ggplot2 using the theme() function. To remove the label from facet plot, we need to use “strip.text.x” argument inside the theme() layer with argument ‘element_blank()’.
Syntax:
plot + theme( strip.text.x = element_blank() )
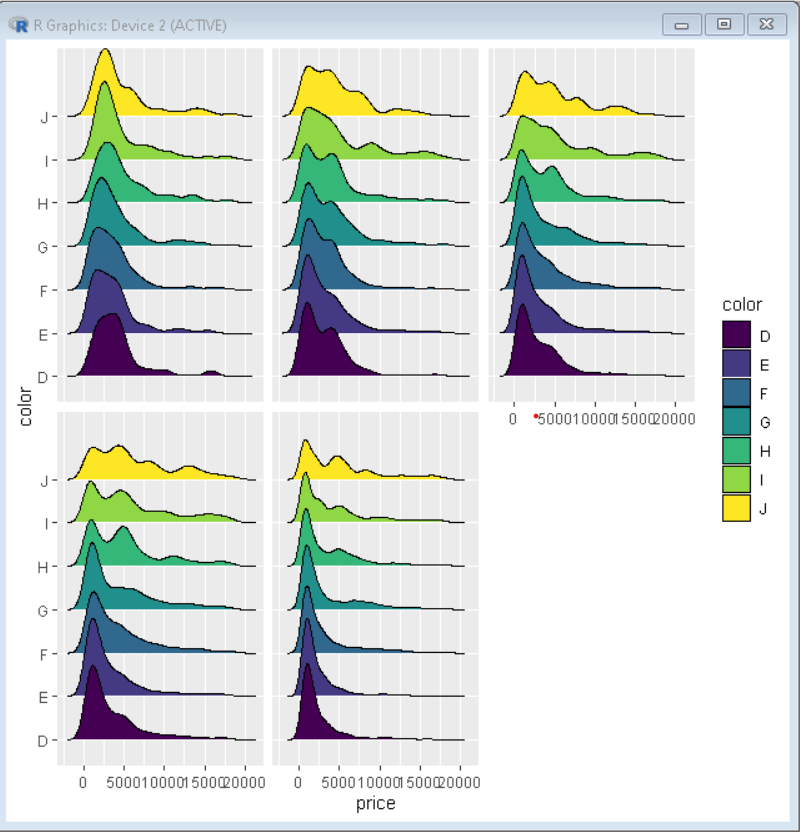
Example: Removing the label from facet plot
R
library(ggridges)
library(tidyverse)
ggplot(diamonds, aes(x=price, y=color, fill=color)) +
geom_density_ridges()+
facet_wrap(~cut)+
theme(strip.text.x = element_blank())
|
Output:
Like Article
Suggest improvement
Share your thoughts in the comments
Please Login to comment...