How to adjust Space Between ggplot2 Axis Labels and Plot Area in R ?
Last Updated :
21 Apr, 2021
While plotting the graphs we can make different changes in order to make them much more appealing and clear to the observer. One of the ways is to adjust the spacing between the labels and plot area. In this article, we will study how to adjust space between ggplot2 Axis Labels and plot area in R Programming Language.
To add customizations to our plot we can use the theme() function.
Method 1: Adjusting vertical spaces
To adjust the vertical spacing we use vjust in the element_text function to vertically adjust the plotting
Example
R
rm(list=ls())
data <- data.frame(name = c("Aditya", "Ritika", "Pulkit",
"Vishesh", "Kaif"),
marks = c(58, 82, 79, 42, 66))
library("ggplot2")
ggp <- ggplot(data, aes(name, marks, fill = name)) +
geom_bar(stat = "identity")
ggp + theme(axis.text.x = element_text(vjust = -12))
|
Output:

vertically adjusted plot
Method 2: Adjust horizontal spacing
We can adjust the horizontal spacing in the similar way using hjust in element_text
Example
R
rm(list=ls())
data <- data.frame(Name = c("Aditya", "Ritika", "Pulkit",
"Vishesh", "Kaif"),
Marks = c(58, 82, 79, 42, 66))
library("ggplot2")
ggp <- ggplot(data, aes(Name, Marks, fill = Name)) +
geom_bar(stat = "identity")
ggp + theme(axis.text.x = element_text(hjust = -1))
|
Output:
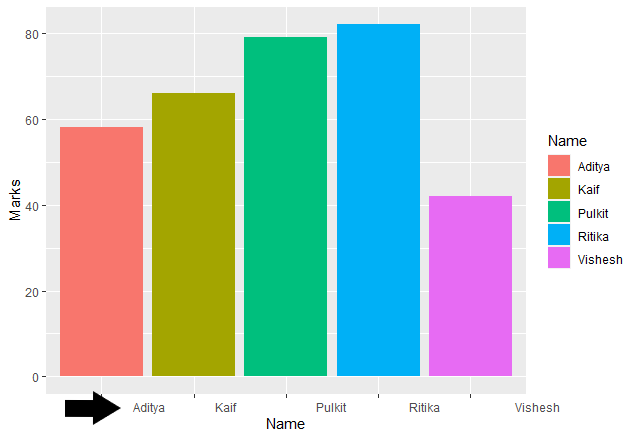
horizontally adjusted plot
Share your thoughts in the comments
Please Login to comment...