Control Size of ggplot2 Legend Items in R
Last Updated :
30 May, 2021
In this article, we will see how to control the size of ggplot2 Legend Items in R Programming Language. To create an R plot, we use ggplot() function and for making a scatter plot geom_point() function is added to ggplot() function.
Let us first create a regular plot without any modifications so that the difference is apparent.
Example:
R
library("ggplot2")
data <- data.frame(Xdata = rnorm(10),
Ydata = rnorm(10),
LegendData = c("ld-01", "ld-02", "ld-03",
"ld-04", "ld-05", "ld-06",
"ld-07", "ld-08", "ld-09",
"ld-10"))
ggplot(data, aes(Xdata, Ydata, color = LegendData)) +
geom_point()
|
Output:
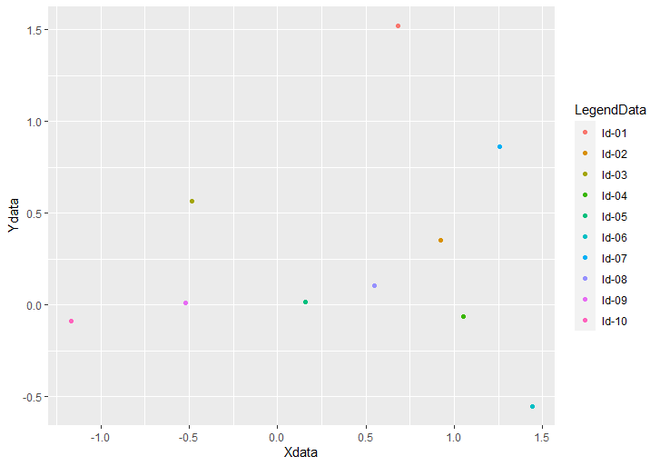
Scatter Plot with Legend
To change the Size of Legend, we have to add guides() and guide_legend() functions to the geom_point() function. Inside guides() function, we take parameter color, which calls guide_legend() guide function as value. Inside guide_legend() function, we take an argument called override.aes, which has the list specifying aesthetic parameters of legend keys. Inside this list, we specify the size of legend.
Syntax : guides(…)
Parameter :
- … : either a string or call to a guide function. here we call guide_legend() guide function.
Return : each scale can be set scale-by-scale
Syntax : guide_legend(override.aes = list())
Parameter :
- override.aes : A list specifying aesthetic parameters of legend key. Inside this list, we specify the size of legend to size object.
Return : Legend Guides for various scales
Example:
R
library("ggplot2")
data <- data.frame(Xdata = rnorm(10),
Ydata = rnorm(10),
LegendData = c("ld-01", "ld-02", "ld-03",
"ld-04", "ld-05", "ld-06",
"ld-07", "ld-08", "ld-09",
"ld-10"))
ggplot(data, aes(Xdata, Ydata, color = LegendData)) +
geom_point()+
guides(color = guide_legend(override.aes = list(size = 10)))
|
Output:
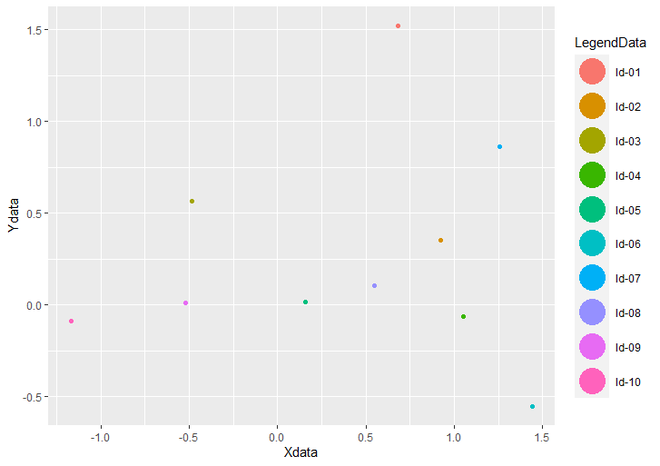
Scatterplot with change size of legend
Share your thoughts in the comments
Please Login to comment...