Control Point Border Thickness of ggplot2 Scatterplot in R
Last Updated :
03 Nov, 2022
In this article, we will see how to control Point Border Thickness of ggplot ScatterPlot in R Programming Language. For this, we will be using geom_point() function. Following is brief information about ggplot function, geom_point().
Syntax : geom_point(size, color, fill, shape, stroke)
Parameter :
- size : Size of Points
- color : Color of Points/Border
- fill : Color of Points
- shape : Shape of Points in in range from 0 to 25
- stroke : Thickness of point border
Return : It creates scatterplots.
Let us first create a scatterplot with no modification so that the difference is apparent.
Example:
R
library("ggplot2")
data <- data.frame(x = rnorm(10), y = rnorm(10))
ggplot(data, aes(x, y)) +
geom_point(size = 10, color = "green")
|
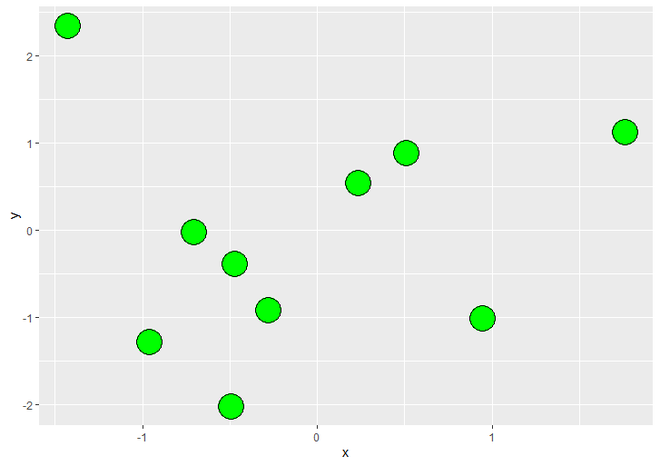
Output:

Scatterplot using ggplot2
To change the shape of the points in scatterplot i.e to make borders around points in Scatterplot, we use shape parameter of geom_point() function to set the value as 21 which specify the shape of points in range from 0 to 25. The following image represents the shape of points with range. Other than that we use fill parameter to fill the color of points and color parameter of border color.
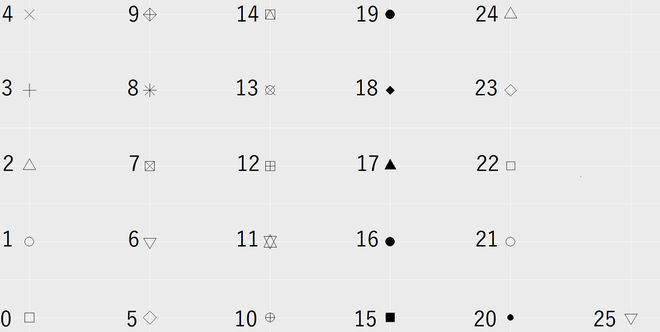
Shapes of Points of Scatterplot with Range
Example:
R
library("ggplot2")
data <- data.frame(x = rnorm(10), y = rnorm(10))
ggplot(data, aes(x, y)) +
geom_point(size = 10, color = "black",
fill = "green", shape = 21)
|
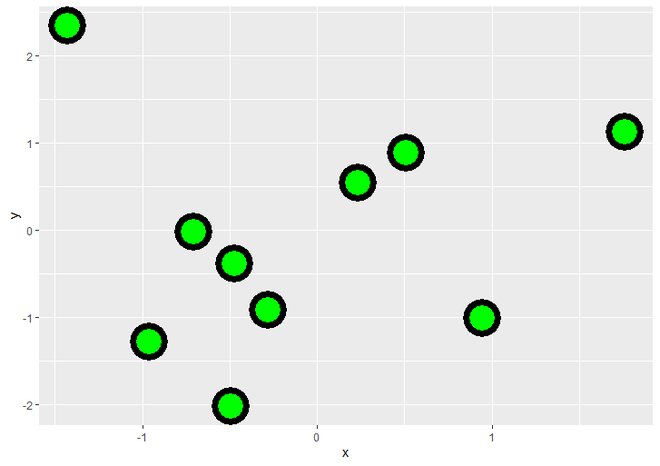
Output:
Scatterplot with borders around points
Now to change the thickness of border, we simply use a parameter inside geom_point() function called stroke, which specify the thickness of the border of points in Scatterplot.
Example:
R
library("ggplot2")
data <- data.frame(x = rnorm(10), y = rnorm(10))
ggplot(data, aes(x, y)) +
geom_point(size = 10, color = "black",
fill = "green", shape = 21,
stroke = 4)
|
Output:
Scatterplot with changed border thickness of points
Share your thoughts in the comments
Please Login to comment...