Control the Size of the Points in a Scatterplot in R
Last Updated :
23 May, 2021
In this article, we are going to see how to control the size of the points in a scatterplot in R Programming language.
We will Control the size of the points in a scatterplot using cex argument of the plot function. In this approach to control the size of the points in a scatterplot, the user needs to call the in-built function plot() and using the cex parameter which will take input value as a float in this function of control the size of the points of the given scatterplot in r language.
Syntax: plot( Data_x, Data_y, cex)
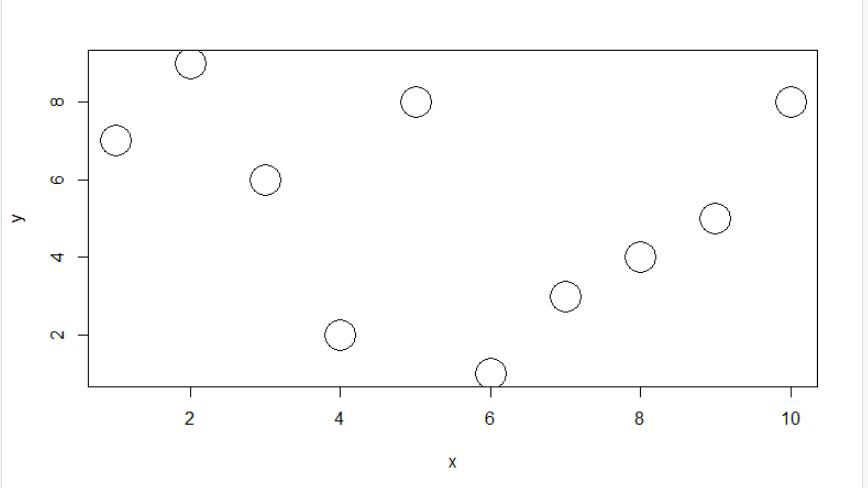
Example 1: Increase the point size in a scatterplot.
In this function, we will be increasing the size of the points of the given scatterplot using the cex argument of the plot function of r language. Here cex will be set to 4 which will increase the size of the points of the scatterplot.
Python3
x = c(1, 2, 3, 4, 5, 6, 7, 8, 9, 10)
y = c(7, 9, 6, 2, 8, 1, 3, 4, 5, 8)
plot(x, y, cex = 4)
|
Output:
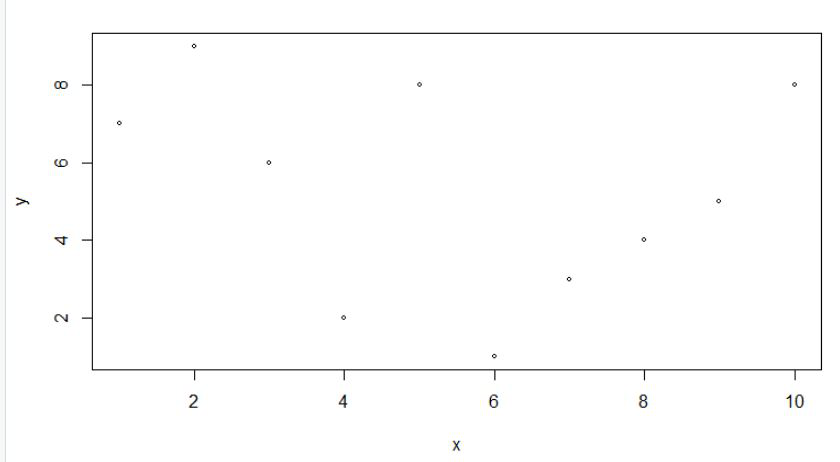
Example 2: Decreasing the point size in a scatterplot.
In this function, we will be decreasing the size of the points of the given scatterplot using the cex argument of the plot function of r language. Here cex will be set to 0.6 which will decrease the size of the points of the scatterplot.
R
x = c(1, 2, 3, 4, 5, 6, 7, 8, 9, 10)
y = c(7, 9, 6, 2, 8, 1, 3, 4, 5, 8)
plot( x, y, cex = 0.6)
|
Output:
Share your thoughts in the comments
Please Login to comment...