Draw Scatterplot with Labels in R
Last Updated :
23 May, 2021
In this article, we will be looking at the different approaches to draw scatter plot with labels in the R programming language.
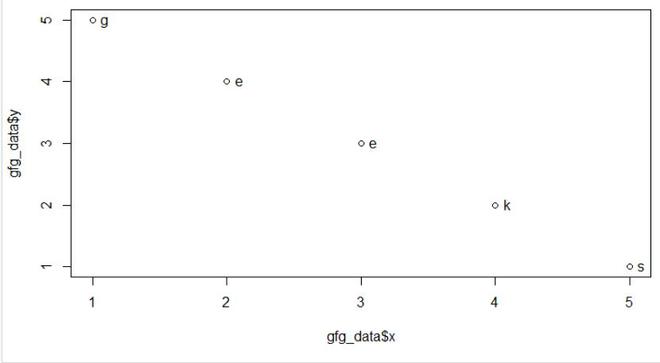
Method1: Using text() function
In this approach of plotting scatter plot with labels using text() function, user need to call the text() function which is used to add the labels in the plot with required parameters in R programming language.
Syntax: text(x, y, labels)
Parameters:
x and y: numeric values specifying the coordinates of the text to plot
labels: the text to be written
Returns: Added text to plot
Example:
R
gfg_data <- data.frame(x =c(1,2,3,4,5),
y = c(5,4,3,2,1),
lab=c('g','e','e','k','s'))
gfg_data
plot(gfg_data$x,
gfg_data$y)
text(gfg_data$x,
gfg_data$y,
labels = gfg_data$lab,
pos = 4)
|
Output:
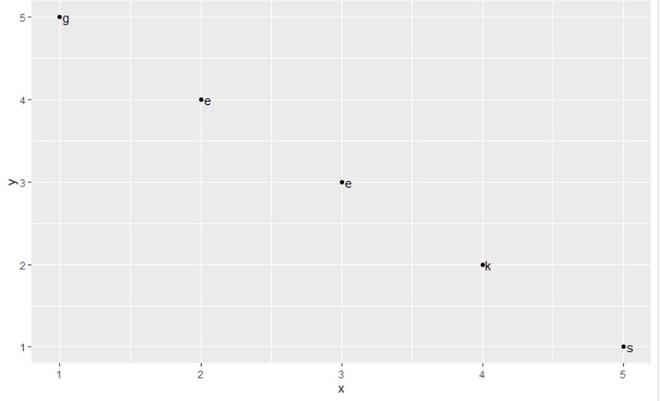
Method 2: Using geom_text() function
In this approach to plot scatter plot with labels, user firstly need to install and load the ggplot2 package and call geom_text() function from ggplot2 package with required parameters, this will lead to plotting of scatter plot with labels.
Syntax: geom_text(mapping = NULL, data = NULL, stat = “identity”,position = “identity”, parse = FALSE, …)
Parameters:
- parse:-If TRUE, the labels will be parsed into expressions and displayed as described in ?plotmath.
- mapping:-The aesthetic mapping, usually constructed with aes or aes_string.
- data:-A layer-specific dataset – only needed if you want to override the plot defaults.
- stat:-The statistical transformation to use on the data for this layer.
- position:-The position adjustment to use for overlapping points on this layer
- …:-other arguments passed on to layer. This can include aesthetics whose values you want to set, not map.
Example:
R
gfg_data <- data.frame(x =c(1,2,3,4,5),
y = c(5,4,3,2,1),
lab=c('g','e','e','k','s'))
gfg_data
ggplot(gfg_data, aes(x, y, label = lab)) + geom_point() +
geom_text(aes(label = lab), hjust = - 0.5)
|
Output:
Share your thoughts in the comments
Please Login to comment...