3D Mesh Plots using Plotly in Python
Last Updated :
01 Oct, 2020
Plotly is a Python library that is used to design graphs, especially interactive graphs. It can plot various graphs and charts like histogram, barplot, boxplot, spreadplot, and many more. It is mainly used in data analysis as well as financial analysis. plotly is an interactive visualization library
3D Mesh Plots
A Mesh plot is a plot that has three dimensions surface and has solid edges and no face colors. A Mesh plot is a way to create a 3D set of triangles with vertices given by x, y, and z. If there are only coordinates, then algorithm such as Delaunay triangulation is used to form a triangle. I, J, and K parameters can also be used to create a triangle.
Syntax: class plotly.graph_objects.Mesh3d(arg=None, hoverinfo=None, x=None, y=None, z=None, **kwargs)
Parameters:
arg: dict of properties compatible with this constructor or an instance of plotly.graph_objects.Mesh3d
hoverinfo: Determines which trace information appear on hover. If none or skip are set, no information is displayed upon hovering. But, if none is set, click and hover events are still fired.
x: Sets the X coordinates of the vertices. The nth element of vectors x, y and z jointly represent the X, Y and Z coordinates of the nth vertex.
y: Sets the Y coordinates of the vertices. The nth element of vectors x, y and z jointly represent the X, Y and Z coordinates of the nth vertex.
z: Sets the Z coordinates of the vertices. The nth element of vectors x, y and z jointly represent the X, Y and Z coordinates of the nth vertex.
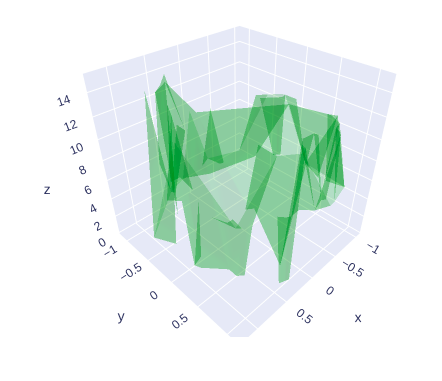
Example 1:
Python3
import plotly.graph_objects as go
import numpy as np
z = 15 * np.random.random(100)
x = np.sin(z) + 0.1 * np.random.randn(100)
y = np.cos(z) + 0.1 * np.random.randn(100)
fig = go.Figure(data=[go.Mesh3d(
x=x, y=y, z=z, color='green', opacity=0.20)])
fig.show()
|
Output:
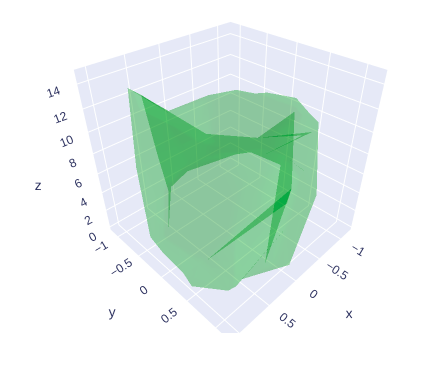
Example 2: 3D Mesh example with Alphahull parameter
In plotly, the alphahull parameter is used to set the shape of the mesh plot. It Determines how the mesh surface triangles are derived from the set of vertices (points) represented by the x, y, and z arrays, if the i, j, k arrays are not supplied. For general use of mesh3d, it is preferred that i, j, k are supplied. If “-1”, Delaunay triangulation is used, which is mainly suitable if the mesh is a single, more or less layer surface that is perpendicular to delaunayaxis. In case the delaunayaxis intersects the mesh surface at more than one point it will result in triangles that are very long in the dimension of delaunayaxis. If “>0”, the alpha-shape algorithm is used. In this case, the positive alphahull value signals the use of the alpha-shape algorithm, _and_ its value acts as the parameter for the mesh fitting. If 0, the convex-hull algorithm is used. It is suitable for convex bodies or if the intention is to enclose the x, y, and z points set into a convex hull.
Example:
Python3
import plotly.graph_objects as go
import numpy as np
z = 15 * np.random.random(100)
x = np.sin(z) + 0.1 * np.random.randn(100)
y = np.cos(z) + 0.1 * np.random.randn(100)
fig = go.Figure(data=[go.Mesh3d(x=x, y=y, z=z, color='green',
opacity=0.20, alphahull=3)])
fig.show()
|
Output:
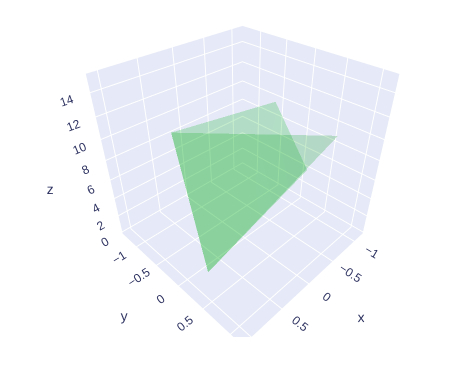
Showing Mesh Tetrahedron
In mesh tetrahedron i,j, and k parameters can be used to manually specify the geometry of the triangles of the mesh.
Example:
Python3
import plotly.graph_objects as go
import numpy as np
z = 15 * np.random.random(100)
x = np.sin(z) + 0.1 * np.random.randn(100)
y = np.cos(z) + 0.1 * np.random.randn(100)
fig = go.Figure(data=[go.Mesh3d(x=x, y=y, z=z, color='green',
opacity=0.20, alphahull=3,
i=[1, 0, 0, 1],
j=[1, 2, 3, 4],
k=[4, 3, 1, 3],)])
fig.show()
|
Output:
Share your thoughts in the comments
Please Login to comment...