What is Regression Line?
Regression Line is defined as a statistical concept that facilitates and predicts the relationship between two or more variables. A regression line is a straight line that reflects the best-fit connection in a dataset between independent and dependent variables. The independent variable is generally shown on the X-axis and the dependent variable is shown on the Y-axis. The main purpose of developing a regression line is to predict or estimate the value of the dependent variable based on the values of one or more independent variables.

Equation of Regression Line
The equation of a simple linear regression line is given by:
Y = a + bX + ε
Here,
- Y is the dependent variable
- X is the independent variable
- a is the y-intercept, which represents the value of Y when X is 0.
- b is the slope, which represents the change in Y for a unit change in X
- ε is residual error.
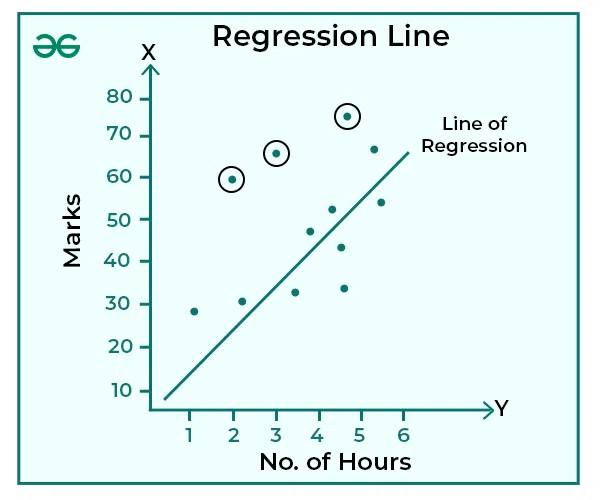
Graphical Representation of Regression Line
In the graph above, the green dots represent observed data points, and the grey line is the regression line. It represents the best linear approximation of the relationship between X and Y.
Example of Regression Line
Example 1:
A function facilitates the calculation of marks scored by the students when the number of hours studied by them is given. The slope and y-intercept of the given function are 5 and 50 respectively. Using this information, form a regression line equation.
Solution:
In case of calculation of marks scored by students, when the numbers of hours each of them studied are given, Marks will be the dependent variable (i.e. marks will be represented by Y) and number of hours studied will be the dependant variable (i.e. number of hours studied by the students will be represented by X). Now, the general linear regression equation is Y = a + bX.
We have been given that the y-intercept is 50, (i.e., a = 50) and the respective slope is 5, (i.e. b = 5).
Therefore, the required equation of regression line will be,
Y = 50 + 5X + ε
Example 2:
In continuation with the above example, the figures of three students are given as follows:
Student 1: Studied for 2 hours and scored 60 marks.
Student 2: Studied for 3 hours and scored 65 marks.
What will the marks scored by the 4th student in case he/she studies for 5 hours.
Solution:
The required equation of regression line as calculated in previous example is,
Y = 50 + 5X
In case of 4th student, who studies for 5 hours (X = 5), the marks scored by him will be calculated as,
Y = 50 + 5X.
Y = 50 + 5(5)
Y = 75 Marks
Types of Regression Lines
1. Linear Regression Line: Linear regression line is utilised when there is a linear relationship between the reliant variable and at least one free variables. The condition of a straightforward linear relapse line is typically; Y = a + bX + ε, where Y is the reliant variable, X is the free variable, a is the y-intercept, b is the slope, and ε is error.
2. Logistic Regression Line: Logistic regression is used when the dependent variable is discrete. It models the probability of a binary outcome using a logistic function. The equation is typically expressed as the log-odds of the probability.
3. Polynomial Regression Line: Polynomial regression is used when the relationship between the dependent and independent variables is best represented by a polynomial equation. The equation is Y = aX2 + bX + c, or even higher-order polynomial equations.
4. Ridge and Lasso Regression: These are used for regularisation in linear regression. Ridge and Lasso add penalty terms to the linear regression equation to prevent overfitting and perform feature selection.
5. Non-Linear Regression Line: For situations where the relationships between variables is not linear, non-linear regression lines must be used to defined the relationship.
6. Multiple Regression Line: This involves multiple independant variables to predict a dependant variable. It is an extension of linear regression.
7. Exponential Regression Line: Exponential Regression Line is formed when the data follows an exponential growth or decay pattern. It is often seen in fields like biology, finance, and physics.
8. Pricewise Regression Line: In this approach, the data is divided into segments, and a different linear or no linear model is applied to each segment.
9. Time Series Regression Line: This approach is used to deal with time-series data, and models how the dependent variable changes over time.
10. Power Regression Line: This type of regression line is used when one variable increases at a power of another. It can be applied to situations where exponential growth does not fit.
Applications of Regression Line
Regression lines have numerous uses in a variety of domains, including:
1. Economics: Regression analysis is used in economics to anticipate economic trends, evaluate consumer behaviour, and identify factors influencing economic variables such as GDP, inflation, and unemployment.
2. Finance: Regression analysis is used in portfolio management to estimate risk and return of investments. It aids in the prediction of stock prices, bond yields, and other financial measures.
3. Medicine: Regression analysis is used in the medical field to investigate the link between variables such as dosage and patient response, as well as to predict patient outcomes based on a variety of criteria.
4. Marketing: Regression analysis is used by marketers to understand the impact of advertising, pricing, and other marketing initiatives on sales and customer behavior.
5. Environmental Science: Regression analysis is used by researchers to model the link between environmental parameters (such as temperature and pollution levels) and their impact on ecosystems.
Importance of Regression Line
The regression line holds immense importance for several reasons:
1. Error Analysis: Regression analysis provides a way to assess the goodness of fit of a model. By examining residuals (the differences between observed and predicted values), one can identify patterns and trends in the errors, which further helps in the improvement of models.
2. Variable Selection: Regression analysis helps in the selection of relevant variables. While having a large dataset with many potential predictors, regression analysis can provide guidance in identifying which variables have a significant impact on the outcome, enabling more efficient and parsimonious models.
3. Quality Control: In manufacturing and quality control processes, regression analysis can be used to monitor and control product quality. By understanding the relationship between input variables and product quality, manufacturers can make adjustments to maintain or improve quality standards.
4. Forecasting: Regression models can be used for time series analysis and forecasting. This is valuable in industries like retail, where understanding historical sales data can help in predicting future sales, optimising inventory levels, and planning for seasonal demand.
5. Risk Assessment: In finance and insurance, regression analysis is crucial for assessing and managing risk. It can help identify factors affecting investment returns, loan defaults, or insurance claims, aiding in risk assessment and pricing.
6. Policy Evaluation: In social sciences and public policy, regression analysis is employed to evaluate the impact of policy changes or interventions. By examining the relationship between policy variables and relevant outcomes, researchers can assess the effectiveness of different policies and inform decision-makers.
Statistical Significance of Regression Line
In statistical analysis, it is crucial to determine whether the relationship between the independent and dependent variables is statistically significant. This is usually done using hypothesis tests and confidence intervals. A small p-value associated with the slope ‘b’ suggests that the relationship is statistically significant.
Conclusion
The regression line is a very useful tool in statistics and data analysis. It lets us measure and comprehend variable correlations, create predictions, and inform decision-making processes in a variety of domains. Its formula and graphical depiction make it easy to evaluate and apply regression analysis results. The regression line is a cornerstone of statistical analysis and modeling, whether in economics, finance, or the natural sciences.
Share your thoughts in the comments
Please Login to comment...