What is DFD(Data Flow Diagram)?
Last Updated :
20 Sep, 2023
DFD is the abbreviation for Data Flow Diagram. The flow of data of a system or a process is represented by DFD. It also gives insight into the inputs and outputs of each entity and the process itself. DFD does not have control flow and no loops or decision rules are present. Specific operations depending on the type of data can be explained by a flowchart. It is a graphical tool, useful for communicating with users ,managers and other personnel. it is useful for analyzing existing as well as proposed system.
It should be pointed out that a DFD is not a flowchart. In drawing the DFD, the designer has to specify the major transforms in the path of the data flowing from the input to the output. DFDs can be hierarchically organized, which helps in progressively partitioning and analyzing large systems.
It provides an overview of
- What data is system processes.
- What transformation are performed.
- What data are stored.
- What results are produced , etc.
Data Flow Diagram can be represented in several ways. The DFD belongs to structured-analysis modeling tools. Data Flow diagrams are very popular because they help us to visualize the major steps and data involved in software-system processes. 
Characteristics of DFD
- DFDs are commonly used during problem analysis.
- DFDs are quite general and are not limited to problem analysis for software requirements specification.
- DFDs are very useful in understanding a system and can be effectively used during analysis.
- It views a system as a function that transforms the inputs into desired outputs.
- The DFD aims to capture the transformations that take place within a system to the input data so that eventually the output data is produced.
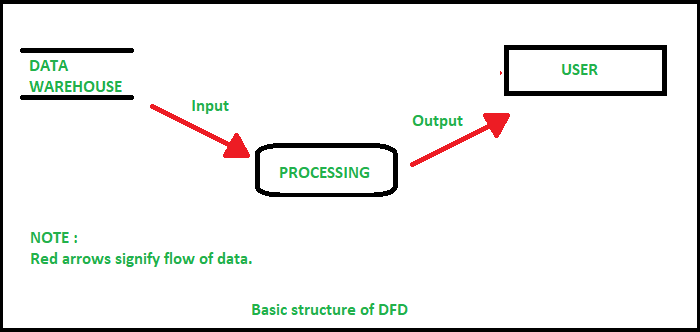
- The processes are shown by named circles and data flows are represented by named arrows entering or leaving the bubbles.
- A rectangle represents a source or sink and it is a net originator or consumer of data. A source sink is typically outside the main system of study.
Components of DFD
The Data Flow Diagram has 4 components:
- Process Input to output transformation in a system takes place because of process function. The symbols of a process are rectangular with rounded corners, oval, rectangle or a circle. The process is named a short sentence, in one word or a phrase to express its essence
- Data Flow Data flow describes the information transferring between different parts of the systems. The arrow symbol is the symbol of data flow. A relatable name should be given to the flow to determine the information which is being moved. Data flow also represents material along with information that is being moved. Material shifts are modeled in systems that are not merely informative. A given flow should only transfer a single type of information. The direction of flow is represented by the arrow which can also be bi-directional.
- Warehouse The data is stored in the warehouse for later use. Two horizontal lines represent the symbol of the store. The warehouse is simply not restricted to being a data file rather it can be anything like a folder with documents, an optical disc, a filing cabinet. The data warehouse can be viewed independent of its implementation. When the data flow from the warehouse it is considered as data reading and when data flows to the warehouse it is called data entry or data updating.
- Terminator The Terminator is an external entity that stands outside of the system and communicates with the system. It can be, for example, organizations like banks, groups of people like customers or different departments of the same organization, which is not a part of the model system and is an external entity. Modeled systems also communicate with terminator.
Rules for creating DFD
- The name of the entity should be easy and understandable without any extra assistance(like comments).
- The processes should be numbered or put in ordered list to be referred easily.
- The DFD should maintain consistency across all the DFD levels.
- A single DFD can have a maximum of nine processes and a minimum of three processes.
Symbols Used in DFD
- Square Box: A square box defines source or destination of the system. It is also called entity. It is represented by rectangle.
- Arrow or Line: An arrow identifies the data flow i.e. it gives information to the data that is in motion.
- Circle or bubble chart: It represents as a process that gives us information. It is also called processing box.
- Open Rectangle: An open rectangle is a data store. In this data is store either temporary or permanently.
Levels of DFD
DFD uses hierarchy to maintain transparency thus multilevel DFD’s can be created. Levels of DFD are as follows:
- 0-level DFD: It represents the entire system as a single bubble and provides an overall picture of the system.
- 1-level DFD: It represents the main functions of the system and how they interact with each other.
- 2-level DFD: It represents the processes within each function of the system and how they interact with each other.
- 3-level DFD: It represents the data flow within each process and how the data is transformed and stored.
Advantages of DFD
- It helps us to understand the functioning and the limits of a system.
- It is a graphical representation which is very easy to understand as it helps visualize contents.
- Data Flow Diagram represent detailed and well explained diagram of system components.
- It is used as the part of system documentation file.
- Data Flow Diagrams can be understood by both technical or nontechnical person because they are very easy to understand.
Disadvantages of DFD
- At times DFD can confuse the programmers regarding the system.
- Data Flow Diagram takes long time to be generated, and many times due to this reasons analysts are denied permission to work on it.
Like Article
Suggest improvement
Share your thoughts in the comments
Please Login to comment...