Uses of Chrome Developer Tools
Last Updated :
13 Nov, 2023
Chrome developer tools are a set of features available in Chrome for web developers to make the process of website development more efficient by providing many useful tools that assist the developers in different aspects of development. These tools range from displaying the entire code of the web page to viewing all API calls being made and even accessing the response if have permission to do so. These tools open up in a separate tab which can be docked anywhere on the screen, can be resized, and even moved to a new window.
- Quick and efficient: The developer tools are directly accessible on the Chrome browser, meaning developers can edit websites without alternating windows or tabs. Working in a single window enhances the productivity of the developer.
- Functionality: It helps to enhance a website’s functionality. Developers can debug and know what errors exist on the page, test changes and optimize the respective web pages, monitor network activity and performance, and more.
- UI assisting tools: It features a device mode that allows you to simulate how the website will look and behave on different devices and screen sizes. This is useful for checking the responsiveness and compatibility of the website.
There are different methods to open the Chrome developer tool and here are the list and steps to open the developer tool:
- Method 1: Right-click on an active Chrome tab screen and click on inspect, this directly opens up the developer tools
- Method 2: Right-click on three dots at the end of the Chrome toolbar then click on more tools and after that click on developer tools.
- Method 3: Press ctrl + shift + I to open up the developer tools
.png)
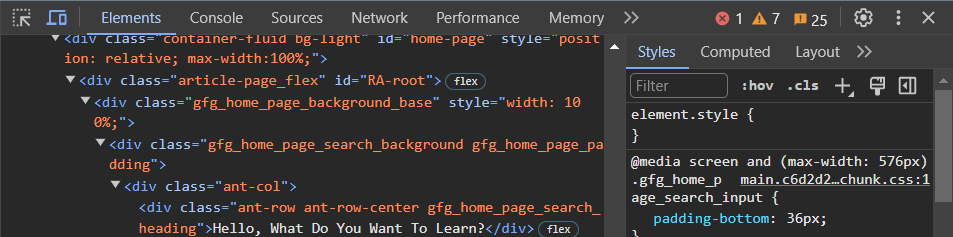
Elements Tab: This tab is divided into two parts. The first part displays the entire HTML code on the active web page and the other part lists all CSS properties of the web page in order of inheritance. Developers can change the HTML and CSS to view live changes in the page locally, as this won’t affect the original web page. This feature is only for development purposes, so developers can view their changes live and write code accordingly.
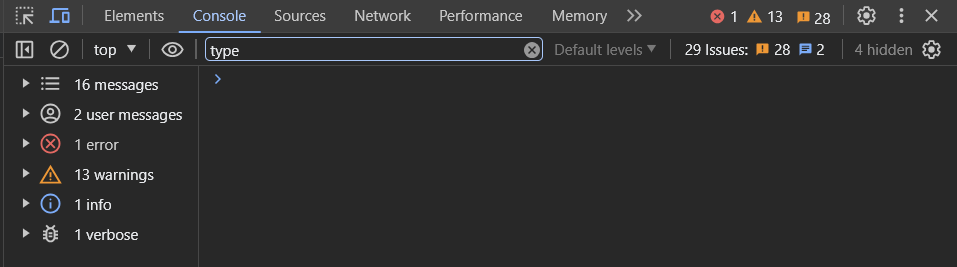
Console Tab: This tab is built specifically for all JavaScript-related issues and logs. It has an editor space in which developers can write JavaScript and run it in the browser. The editor also lists the errors, warnings, and print logs from the running javascript file of the web page. Developers can easily locate and eliminate the errors that are hindering the execution of JavaScript.
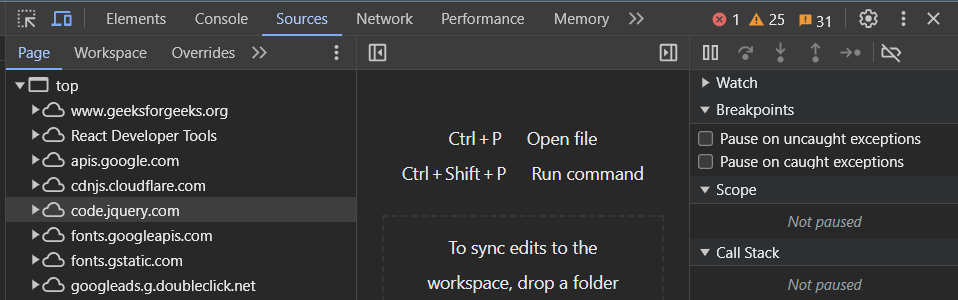
Sources Tab: This tab displays the entire viewable file structure of the website. Developers can access all HTML, CSS, and JavaScript files of the website if they have the necessary rights to do so. This particularly helps in debugging the javascript files and keeping track of the execution stack.
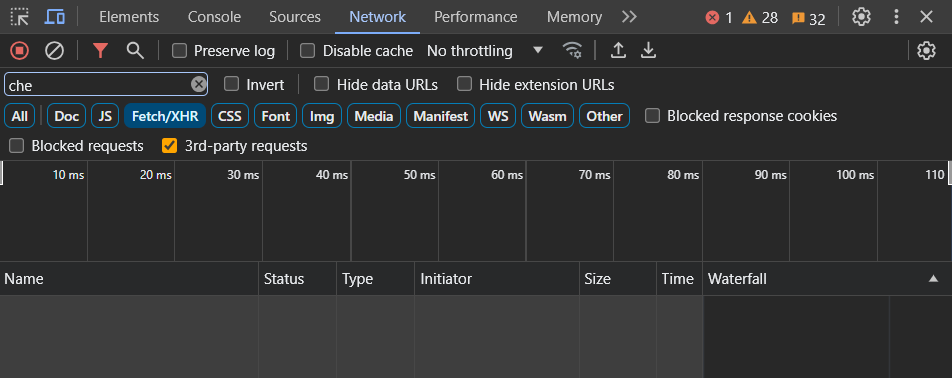
Network Tab: This tab shows all network calls, API calls, and any incoming or outgoing resource calls from the server or to the server. Developers can even view the responses to the API calls being made.
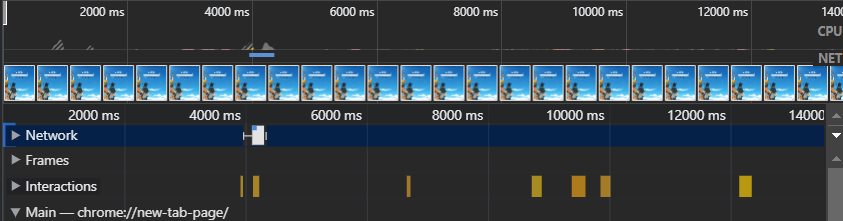
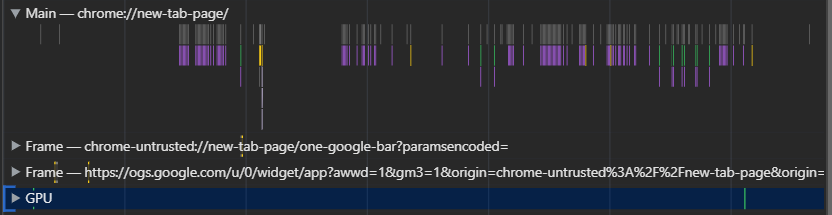
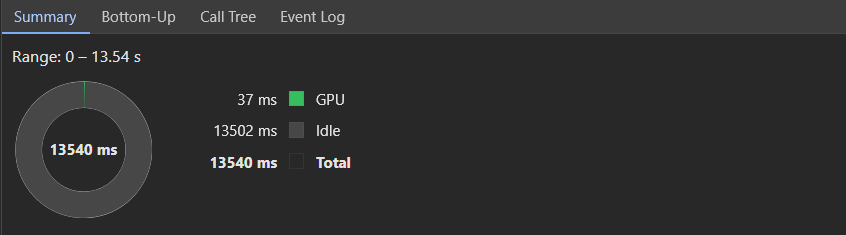
Performance Tab: The Performance tab in Google Chrome’s Developer Tools is a powerful tool for analyzing and optimizing website performance. It provides insights into loading times, processing activities, and bottlenecks, offering detailed timelines showcasing resource utilization, network requests, and JavaScript execution. Developers use this tab to identify and address performance issues, aiming to enhance site speed and the user experience by pinpointing areas for improvement within the code and network interactions.
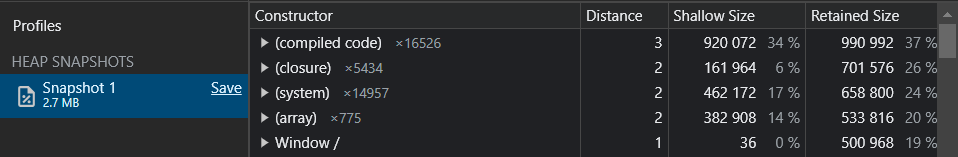
Memory Tab: The Memory tab within Google Chrome’s Developer Tools is designed to assist developers in analyzing a web page’s memory usage. It offers a comprehensive view of memory-related data, displaying information on JavaScript memory usage, DOM nodes, event listeners, and more. This tool enables developers to identify memory leaks, inefficient memory consumption, and unused resources, aiding in the optimization of web applications for better performance and stability.
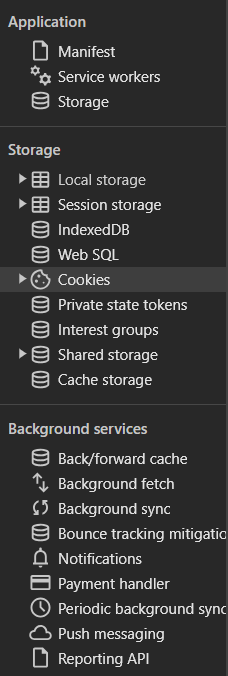
Application Tab: The Application tab within Google Chrome’s Developer Tools is a comprehensive resource for managing various aspects of web applications. It covers diverse functions like managing local storage, session storage, and cookies, allowing developers to inspect and modify these data storage elements. This tab also offers tools to manage caches, service workers, and manifests, enabling developers to troubleshoot and fine-tune these critical components, ensuring optimal performance and a seamless user experience.
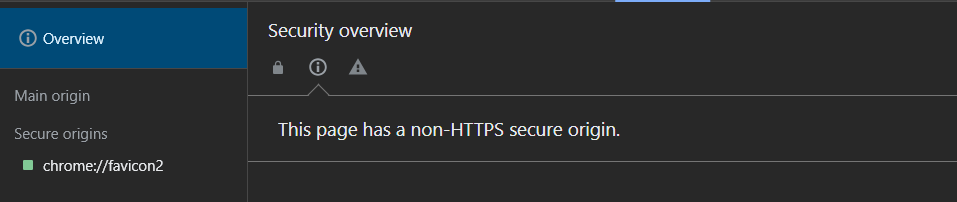
Security Tab: The Security tab within Google Chrome’s Developer Tools is a valuable resource for assessing a website’s security posture. It offers comprehensive information on the site’s security status, highlighting details like HTTPS usage, mixed content warnings, and potential security vulnerabilities. Developers can utilize this tab to review security certificates, understand encryption protocols, and identify any insecure elements on a website, ensuring a more robust and safer browsing experience for users.
Conclusion
Chrome developer tools are a very rich and powerful set of features that help developers build and debug websites efficiently. It offers many insights into the websites, which the developer can use for the better development of the project.
Share your thoughts in the comments
Please Login to comment...