Mozilla Firefox is a privacy-friendly web browser maintained and supported by Mozilla organization. It is completely an open-source project i.e. anyone can view the source code of the browser and contribute to it. It provides various features like an in-browser screenshot tool, reader mode, and more privacy to users and it has been a favorite pick for most users as it works very smoothly on low-end systems and uses very less system resources.
Developer tools are built-in tools provided by the browser that help users and developers analyze the resources used, content, and styles, understand the behavior of web applications, inspect the web page, identify the network calls, memory usage, stack flow, and more. This article will look at the developer tools provided by Mozilla Firefox in the following manner.
- Memory Usage: Firefox Developer Tools helps developers to analyze and optimize memory consumption, making developers optimize the memory resources of the application.
- Network Usage: Developers can inspect network activity, identify the performance bottlenecks, and ensure optimal loading times for web content.
- Debugging the code: It helps developers debug the code interactively by setting breakpoints and analyzing the memory space, call stack, and errors.
- Understanding the behavior of the web page: By looking at the usage of memory, and network, and being able to test in accessibility mode, allowing to debug code, taking the snapshots of the site helps developers providing them a more comprehensive understanding of how their application is working.
- Customization: It also helps users and developers to customize the website by allowing them to modify the CSS of the site through a style editor. They can also import stylesheets and apply them as well.
Step 1: Click the Menu bar on the top right.
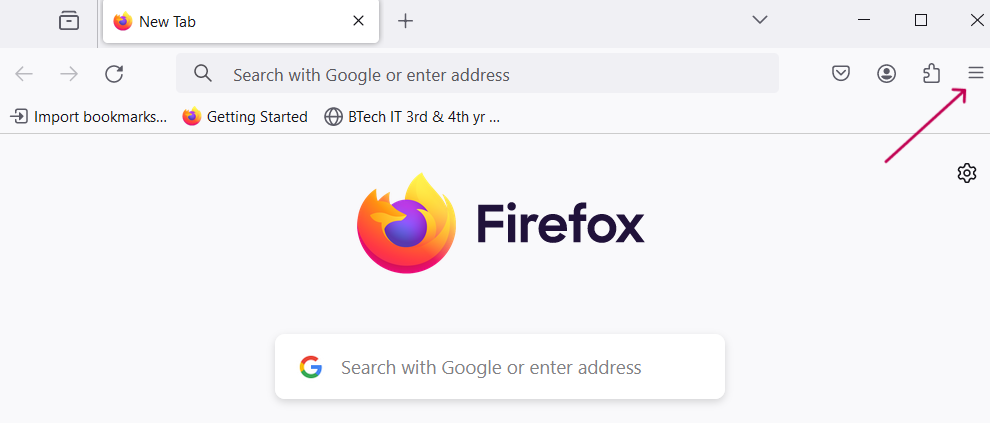
Click on the Menu Bar on the right side.
Step 2: Click on the “More Tools” option.
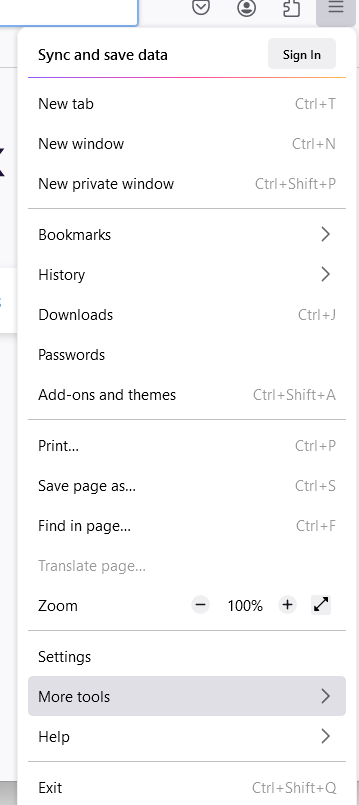
More Tools Option.
Step 3: After Clicking on More Tools, Click on Web Developer Tools to access all the developer tools in Mozilla.
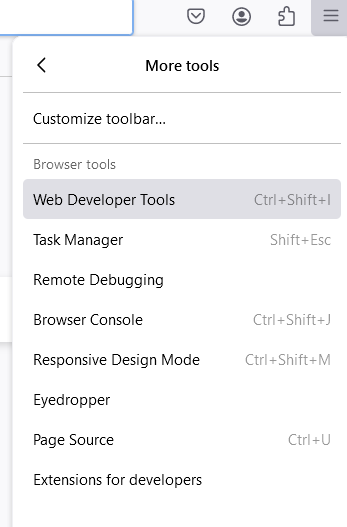
Clicking on Web Developer Tools
Keyboard shortcuts to Open Mozilla Firefox Developer Tools:
- Windows: Ctrl+Shift+I (or) F12.
- Linux: Ctrl+Shift+I (or) F12.
- macOS: Cmd+Opt+I
Developer Tools in Mozilla Firefox.
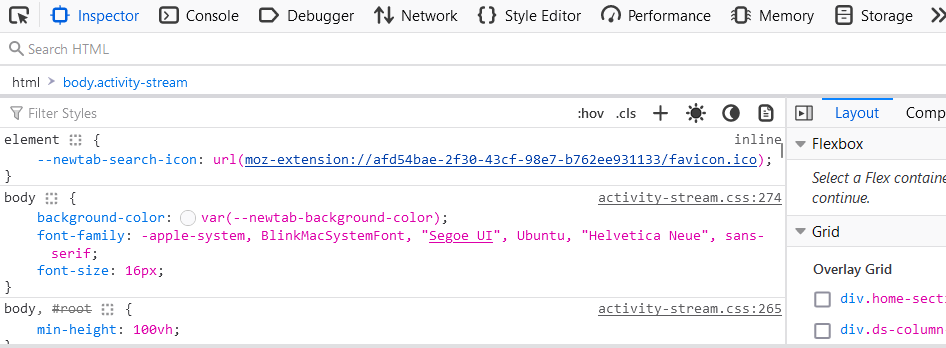
Inspector:
An inspector is used to examine and modify the HTML and CSS of a page. We can examine pages loaded in the local copy of Firefox or a remote target such as Firefox for Android. We can also modify the HTML and CSS content of an element. We can know the HTML, and CSS properties of a certain element by inspecting the element. To inspect and click an element on the web page, Right click on the element and click on Inspect.
 Console:
Console is the Interactive tool for debugging errors or logging the errors. The errors can be logged onto the console which helps the developers understand and fix the issues in the application. We can also run JavaScript code actively on the console.
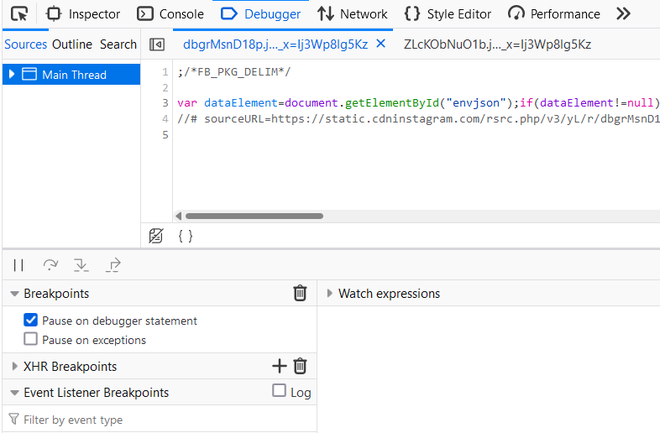
 Debugger:
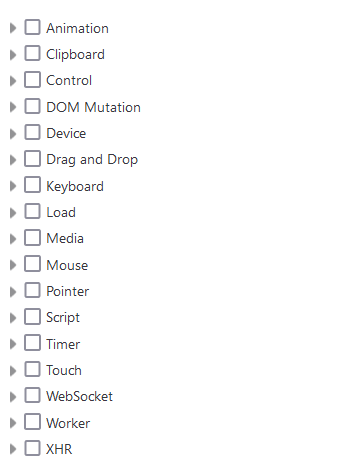
The debugger allows us to debug the code interactively. It allows us to put breakpoints and pause at the specified breakpoints and analyze the code by looking at the call stack, memory space, etc. Breakpoints can be set on specific parts of the code or events like click, scroll, etc.
Network:
The network panel in Developer tools provides us the information about files that are fetched, the type of files being fetched, the type of each request, the size of the response, the domain from which the response was sent, and the waterfall model which shows the timeline of responses received. It allows developers to understand which requests are slow, what kinds of responses are served with large sizes which are causing performance issues etc.
 Style Editor:
Style Editor tool in Firefox allows developers to view the complete CSS files that are applied to the current web page and you can directly modify the CSS code to see the changes live.
Although Inspector provides this feature to view and modify CSS, Style Editor provides complete CSS files and CSS codes as a stylesheet file, in contrast to Inspector, where only properties of a particular element are shown.
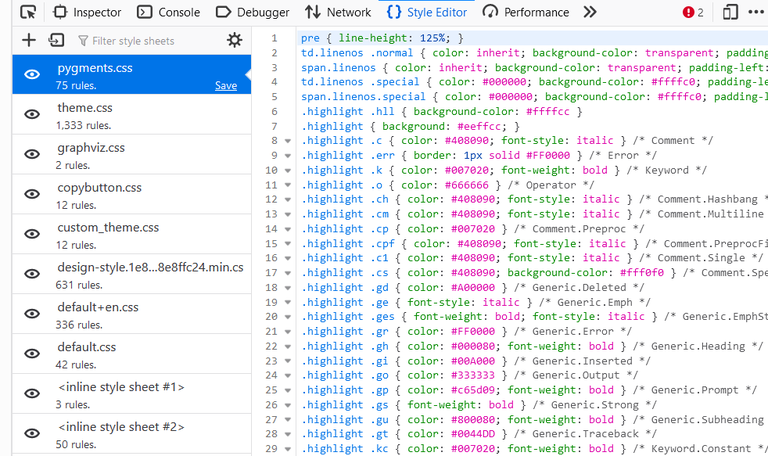
Style Editor in Firefox.
Performance:
It provides information about memory consumption, graphic card performance, CPU usage, etc. about the bottlenecks of applications and provides insights that help to analyze and solve the critical issues in rendering optimized websites.
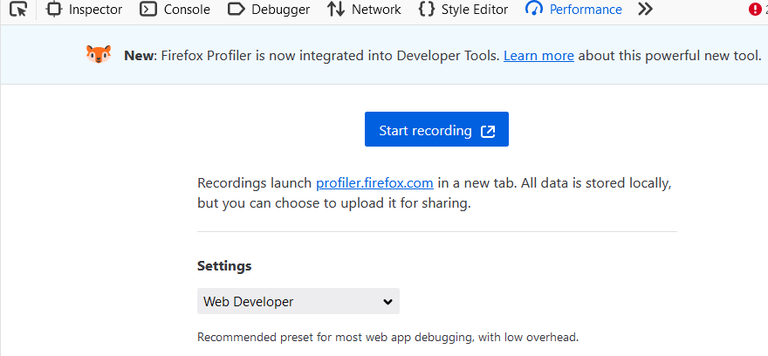
Performance Tool in Firefox.
Memory:
Memory tool in JavaScript helps developers to optimize the memory consumption of web applications by providing information about the Heap Memory how and when objects are created their memory usage etc. It does so by allowing us to take snapshots between two different times analyze how and what objects were created and understand their behaviour.
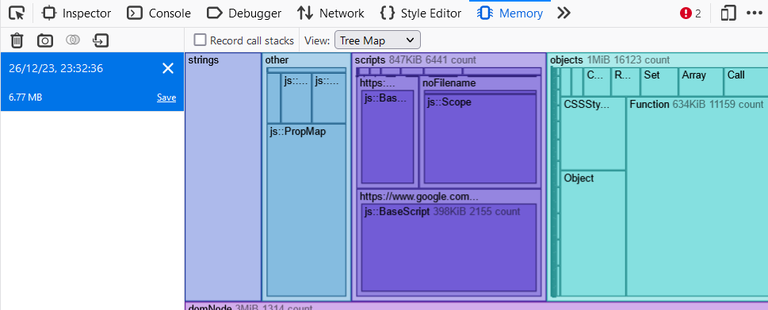
Memory Tool in Firefox.
Storage:
Storage is the area containing Information about various storages and the data our website stores. It consists of many storage types like cookies, cache, local storage, session storage, etc. It also provides the information about validity of the cached data, the domain the data was fetched from, is the data secure or not, etc. We can add, modify, or delete cookies, local storage, and session storage data in the Storage tool.
 Accessibility:
Accessibility features help developers to simulate how a web application works for persons with disabilities. AX tree in Firefox contains the tree structure of the web page in accessibility mode. It allows developers to fix the issues, debug, and test the web application to provide complete functionality to people with disabilities specifically people with visual disabilities.
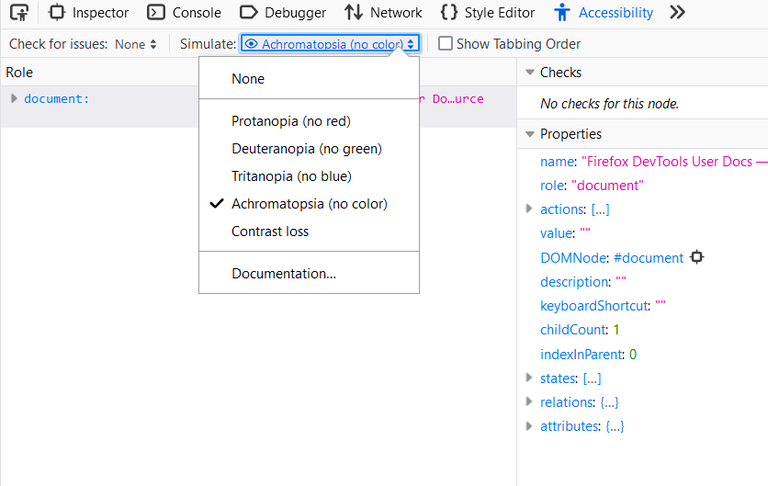
Accessibility Tool in Firefox.
Application:
The application tab provides insights into the Service Workers associated with a webpage. Service Workers are the scripts that run in the background and enable features like push notifications and offline support. It also provides information about Webapp Manifest. Webapp Manifest provides the information about app’s name, icon, and other properties.
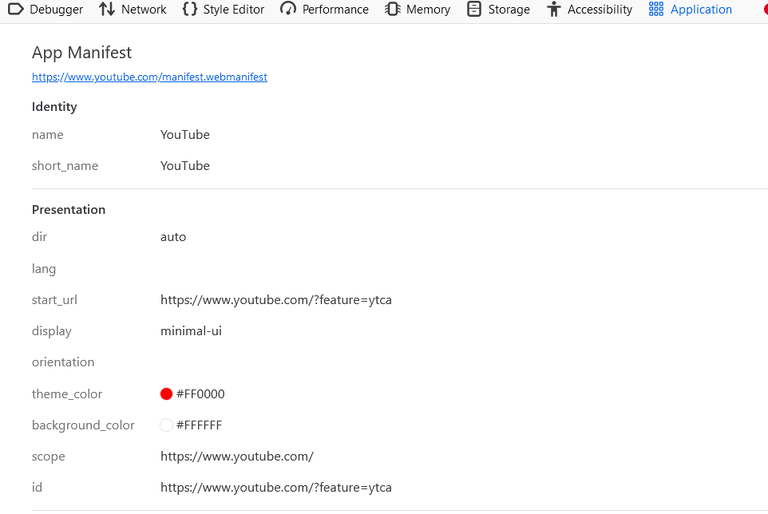
Application Tool in Firefox.
Example:
In this example, we try to look at the accessibility feature provided by Firefox. Initially, we have the Google homepage, When we set stimulate to None, it displays the same as normal. But when we stimulate the web page by setting the stimulate to “Protanopia” (person with a red color disability), the red color in Google Logo fades away. Similarly, if we select Tritanopia, the blue color disappears in the Logo. This way accessibility feature helps developers to deliver the websites to people with visual impairments.
Demonstration of Accessibility feature in Firefox.
Conclusion:
Mozilla Developer Tools provide certain highly useful features that users or developers can use to debug the code and understand the various components of the application like memory, network, etc. better and helps us to optimize and solve the issues in the web application.
Share your thoughts in the comments
Please Login to comment...