Uses of Brave Browser Developer Tools
Last Updated :
27 Feb, 2024
Brave Browser is renowned for its focus on user privacy and speed and offers a rich suite of developer tools that rival those found in Google Chrome and Mozilla Firefox. With these tools, web developers and enthusiasts alike can inspect, debug, and analyze web pages with ease. In this article, we explore the capabilities of Brave Browser’s developer tools, covering their activation, key components, and practical uses.
Activating Developer Tools
To activate Brave Browser’s developer tools, follow these steps:
Step 1: Launch Brave Browser and visit a webpage.
Step 2: Click on the “three-dot” menu in the browser window’s top-right corner.
Step 3: Select “More Tools” followed by “Developer Tools” Alternatively, you can use the keyboard shortcut Control + Shift + I on Windows or Linux, and Command + Option + I on macOS.
Once activated, the developer tools panel appears on the right side of the browser window, offering quick access to various inspection and debugging tools.
Here is the GIF representation of the above Steps.
Brave Devtool Opening
Benefits of Brave Browser:
- Quick and efficient: The developer tools are directly accessible on the Brave Browser itself, meaning developers can edit websites without altering windows or tabs. Working in a single window enhances the productivity of the developer.
- Functionality: It helps to enhance a website’s functionality. Developers can debug and know what errors exist on the page, test changes and optimize the respective web pages, monitor network activity and performance, and more.
- UI assisting tools: It features a device mode that allows you to simulate how the website will look and behave on different devices and screen sizes. This is useful for checking the responsiveness and compatibility of the website.
- Real-time error monitoring: The console panel displays real-time logs of JavaScript errors, warnings, and messages; enables running JavaScript commands within the context of the currently inspected document.
- Source code editing: The sources panel enables source code editing capabilities for JavaScript, CSS, and HTML files.
- Network monitoring: The network panel monitors network requests made during page loading and provides insights into response headers and request parameters.
- Memory leak identification: The memory panel assists in identifying memory leaks and tracking memory consumption.
Key Components of Brave Browser Developer Tools
Brave Browser’s developer tools provide a comprehensive set of functionalities for web developers and enthusiasts to inspect, debug, and optimize web applications. Key components of Brave Browser’s developer tools include:
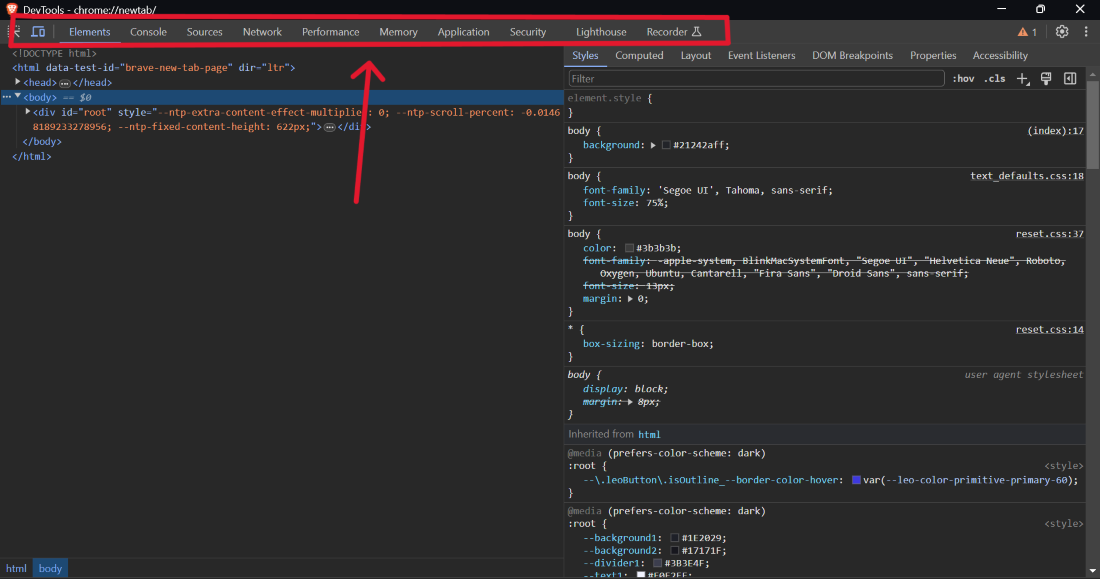
- Elements Panel: Allows you to inspect and modify HTML elements on a webpage.
- Console Panel: Displays real-time logs of JavaScript errors, warnings, and messages; enables running JavaScript commands within the context of the currently inspected document.
- Sources Panel: Enables source code editing capabilities for JavaScript, CSS, and HTML files.
- Network Panel: Monitors network requests made during page loading and provides insights into response headers and request parameters.
- Performance Panel: Helps diagnose performance bottlenecks by profiling scripts, layouts, paint events, and more.
- Memory Panel: Assists in identifying memory leaks and tracking memory consumption.
- Application Panel: Debugs background processes and service workers.
- Security Panel: Provides basic security information, enabling you to view a site’s HTTPS certificate and TLS status.
- Audits Panel: Auto generates reports on site functionality and structure to help developers improve performance.
These components enable web developers to perform tasks such as identifying and fixing broken HTML tags or attributes, debugging JavaScript errors and warnings, optimizing CSS stylesheets for faster rendering, investigating network requests and analyzing response headers, detecting memory leaks and managing memory usage, testing a webpage’s accessibility and search engine optimization, and evaluating a webpage’s performance and usability based on Lighthouse metrics.
Uses of Brave Browser Developer Tools
With Brave Browser’s developer tools, you can perform tasks such as:
- Identifying and fixing broken HTML tags or attributes: The Elements panel allows you to inspect and modify HTML elements on a webpage, making it easy to identify and fix broken tags or attributes.
- Debugging JavaScript errors and warnings: The Console panel provides real-time logging of JavaScript errors, warnings, and messages, making it easy to debug scripts.
- Profiling script execution times and improving performance: The Performance panel helps diagnose performance bottlenecks by profiling scripts, layouts, paint events, and more.
- Optimizing CSS stylesheets for faster rendering: The Sources panel offers source code editing capabilities for CSS files, allowing you to optimize stylesheets for faster rendering.
- Investigating network requests and analyzing response headers: The Network panel monitors network requests made during page loading and provides insights into response headers and request parameters.
- Detecting memory leaks and managing memory usage: The Memory panel assists in identifying memory leaks and tracking memory consumption.
- Testing a webpage’s accessibility and search engine optimization: The Lighthouse panel runs automated tests to evaluate a webpage’s performance, accessibility, SEO, and progressive web app characteristics.
Cross-Platform Availability
Brave Browser’s developer tools are available on both desktop and mobile platforms. On Android devices, you can access developer tools by visiting the “Settings” section under the “Three-Dot Menu” and selecting “Show Advanced Settings.” From there, toggle on “Enable Developer Options” to reveal the “Developer Tools” entry.
Conclusion
Brave Browser’s developer tools offer a versatile and intuitive solution for web developers seeking to inspect, debug, and optimize their creations. By mastering these tools, you can create high-performance, accessible, and visually appealing web experiences that meet today’s demanding standards.
Share your thoughts in the comments
Please Login to comment...