Setup Matplotlib on PyCharm
Last Updated :
08 Dec, 2023
Matplotlib is an effective Python library for producing static, animated, and interactive visualizations in a variety of forms. For data analysis, scientific study, and various other uses, it offers a flexible and effective approach to constructing plots, charts, and graphs. It is built on NumPy arrays, designed to work with the broader SciPy stack, and consists of several plots like lines, bars, scatters, histograms, etc. Matplotlib is often used for a wide variety of applications because it is extremely flexible and provides an extensive range of graphing options.
Important Features Matplotlib
- Basic Plotting: Using Matplotlib, we can produce numerous basic plot types, including line plots, scatter plots, bar charts, histograms, and more.
- Customization: You can alter the colors, line styles, labels, titles, and annotations of your plots using Matplotlib.
- Subplots: It is easy to show different visualizations in a single plot by creating different plots within the same figure.
Setup Matplotlib on PyCharm
Below are the ways by which we can install Matplotlib on PyCharm:
- Using Terminal
- Using PyCharm GUI
Install Matplotlib Using Terminal
Below is the step-by-step procedure to install Matplotlib using Terminal:
Step 1: Installation
The first step is installation. We will install the following things that you can refer for their installation:
Step 2: Create a Virtual Environment
It is the next step after the installation. In this step, we will create a virtual environment for managing project-specific dependencies and avoiding conflicts between different projects. You can refer here : Create a Virtual Environment.
Step 3: Install Matplotlib via PyCharm Terminal
Now that the virtual environment is activated, we can now install Matplotlib using the pip command. Open command-prompt or the built-in terminal in PyCharm and run the following command to install the Matplotlib library.
pip install matplotlib
.jpg)
Installing Matplotlib
To prevent any errors during the matplotlib installation process, just make sure that “pip” is installed and updated to the most recent version on your system.
Setup Matplotlib via PyCharm GUI
To install Matplotlib using PyCharm’s (GUI), follow the steps given below:
Step 1: Create a New Python Project
Create a new Python project or open an existing one in PyCharm. You should be working within a project to manage your Python packages.
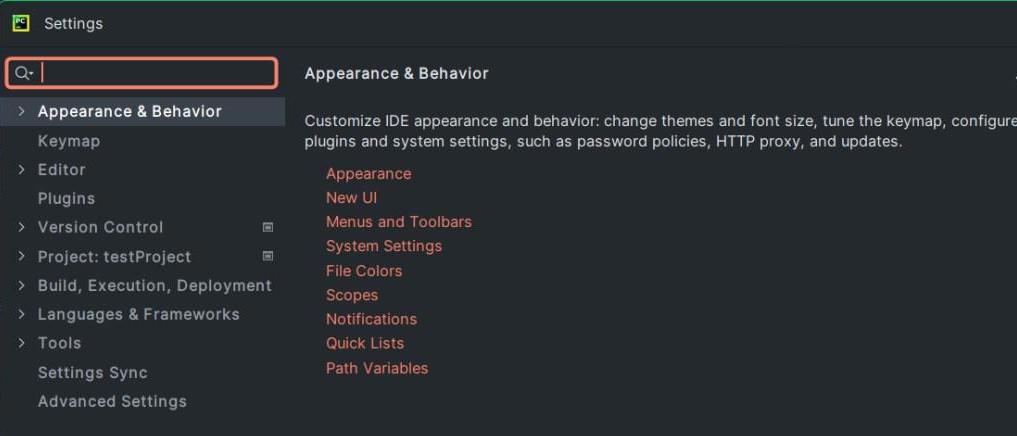
Step 2: Select Settings or Preferences:
Now first go to “File” in the top menu then select “Settings” or “Preferences” (depending on your operating system).
Step 3: Select Python Interpreter
In the settings window, expand the “Project” section on the left sidebar and select “Python Interpreter.” In the “Python Interpreter” window, you’ll see a list of installed packages and the current Python interpreter for your project. Click the ” + ” button or “Install” button to add a new package. This will open the package window showing available packages.
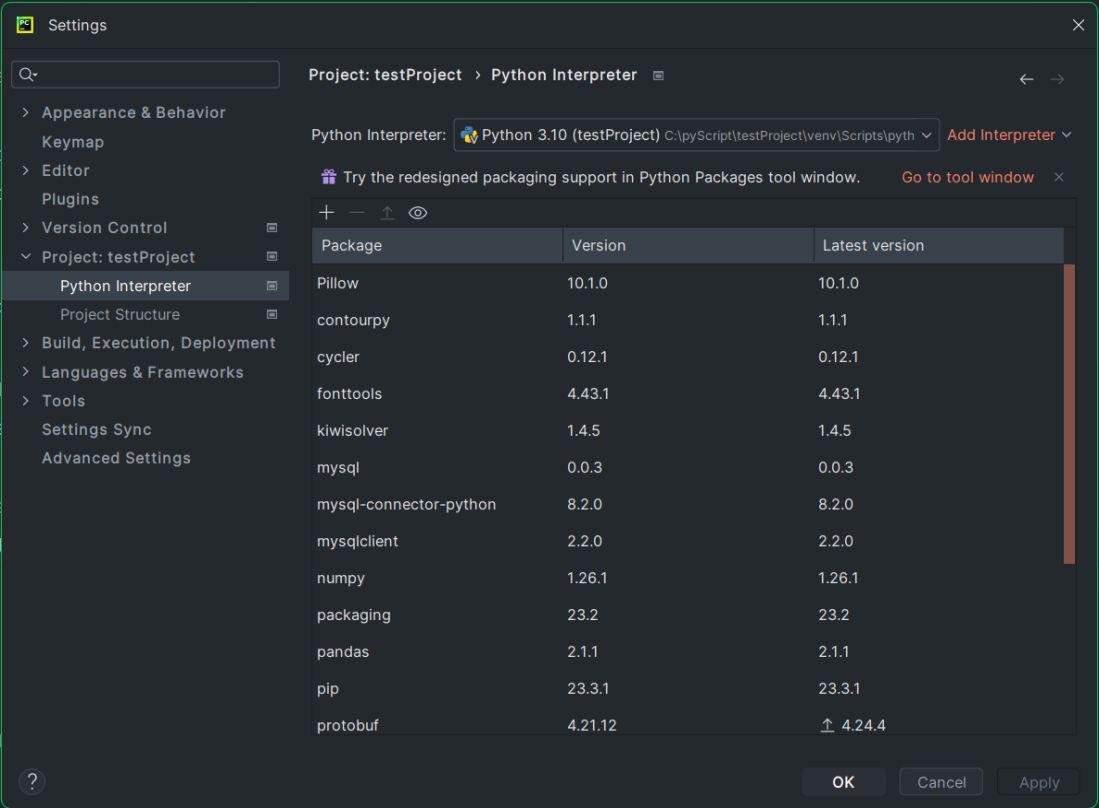
Menu showing Installed libraries and packages
Step 4: Write Matplotlib
In the “Available Packages” window, type “matplotlib” in the search bar. It will display “matplotlib” in the list of packages. Select it. If an older version of the packages is needed for your project, you can also select it by clicking the drop down of “Specify version”.
.jpg)
Selecting Matplotlib from Available Packages
Step 5: Install the Package
Click the “Install Package” button to install Matplotlib. Matplotlib and its dependencies will be downloaded and installed by PyCharm. A progress bar will appear while the installation is being done. Matplotlib should to appear in the list of installed packages for your Python interpreter once the installation is finished.

Matplotlib Installed
Step 6: Writing the Python Script
Create or open a Python script that contains your Matplotlib code to plot the graph. An example of a Python script for graphing is shown below.
Example 1: Plotting a Pie-Chart using Matplotlib
In this example, a pie chart is created using Matplotlib to visualize the distribution of car sales data. The dataset includes car brands such as Audi, BMW, Ford, Dodge, Porsche, and Mercedes, with corresponding sales figures displayed as a pie chart.
Python3
from matplotlib import pyplot as plt
import numpy as np
cars = ['Audi', 'Bmw', 'Ford',
'Dodge', 'Porche', 'Mercedes']
data = [23, 17, 35, 29, 12, 41]
fig = plt.figure(figsize=(10, 7))
plt.pie(data, labels=cars)
plt.show()
|
Output
.jpg)
Python Script for plotting Pie Chart
Example 2: Plotting a Histogram using Matplotlib
In this example, a histogram is generated using Matplotlib to visualize the distribution of a dataset created with random numbers. The dataset x follows a normal distribution, and the resulting histogram, displayed with 20 bins, illustrates the frequency distribution of the data.
Python3
import matplotlib.pyplot as plt
import numpy as np
from matplotlib import colors
from matplotlib.ticker import PercentFormatter
np.random.seed(23685752)
N_points = 10000
n_bins = 20
x = np.random.randn(N_points)
y = .8 ** x + np.random.randn(10000) + 25
fig, axs = plt.subplots(1, 1,
figsize =(10, 7),
tight_layout = True)
axs.hist(x, bins = n_bins)
plt.show()
|
Output
.jpg)
Python Script for plotting Histogram
Plot window appearance: Depending on your system and Matplotlib configuration, the plot window show up as a separate application window.
Share your thoughts in the comments
Please Login to comment...