scipy stats.skew() | Python
Last Updated :
11 Feb, 2019
scipy.stats.skew(array, axis=0, bias=True) function calculates the skewness of the data set.
skewness = 0 : normally distributed.
skewness > 0 : more weight in the left tail of the distribution.
skewness < 0 : more weight in the right tail of the distribution.
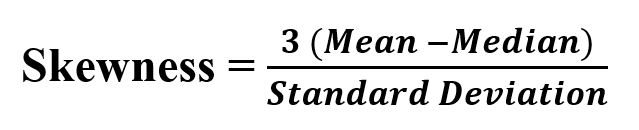
Its formula –
Parameters :
array : Input array or object having the elements.
axis : Axis along which the skewness value is to be measured. By default axis = 0.
bias : Bool; calculations are corrected for statistical bias, if set to False.
Returns : Skewness value of the data set, along the axis.
Code #1:
from scipy.stats import skew
import numpy as np
import pylab as p
x1 = np.linspace( -5, 5, 1000 )
y1 = 1./(np.sqrt(2.*np.pi)) * np.exp( -.5*(x1)**2 )
p.plot(x1, y1, '*')
print( '\nSkewness for data : ', skew(y1))
|
Output :
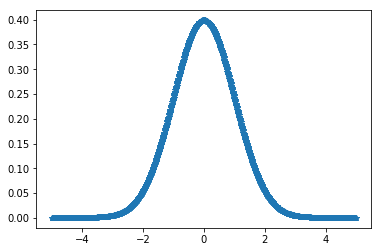 Skewness for data : 1.1108237139164436
Code #2:
from scipy.stats import skew
import numpy as np
import pylab as p
x1 = np.linspace( -5, 12, 1000 )
y1 = 1./(np.sqrt(2.*np.pi)) * np.exp( -.5*(x1)**2 )
p.plot(x1, y1, '.')
print( '\nSkewness for data : ', skew(y1))
|
Output :
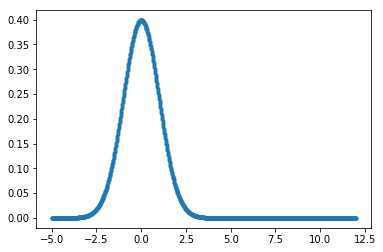 Skewness for data : 1.917677776148478
Code #3: On Random data
from scipy.stats import skew
import numpy as np
x = np.random.normal(0, 2, 10000)
print ("X : \n", x)
print('\nSkewness for data : ', skew(x))
|
Output :
X :
 [ 0.03255323 -6.18574775 -0.58430139 ...  3.22112446  1.16543279
  0.84083317]

Skewness for data :  0.03248837584866293
Share your thoughts in the comments
Please Login to comment...