sciPy stats.hmean() | Python
Last Updated :
07 Feb, 2019
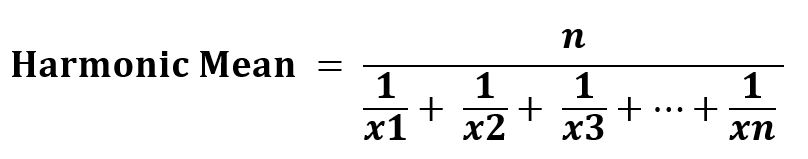
scipy.stats.hmean(array, axis=0, dtype=None) calculates the harmonic mean of the array elements along the specified axis of the array (list in python).
It’s formula –
Parameters :
array: Input array or object having the elements to calculate the harmonic mean.
axis: Axis along which the mean is to be computed. By default axis = 0
dtype: Optional. It sets the type of returned element.
Returns : Harmonic mean of the array elements based on the set parameters.
Code #1:
from scipy.stats.mstats import hmean
arr1 = hmean([1, 3, 27])
print("Harmonic Mean is :", arr1)
|
Output:
Harmonic Mean is : 2.18918918919
Code #2: With multi-dimensional data
from scipy.stats.mstats import hmean
arr1 = [[1, 3, 27],
[3, 4, 6],
[7, 6, 3],
[3, 6, 8]]
print("\nHarmonic Mean is :", hmean(arr1))
print("\nHarmonic Mean is with default axis = 0 : \n",
hmean(arr1, axis = 0))
print("\nHarmonic Mean is with default axis = 1 : \n",
hmean(arr1, axis = 1))
|
Output:
Harmonic Mean is : [ 2.21052632  4.36363636  6.04195804]

Harmonic Mean is with default axis = 0 :
 [ 2.21052632  4.36363636  6.04195804]

Harmonic Mean is with default axis = 1 :
 [ 2.18918919  4.          4.66666667  4.8       ]
Like Article
Suggest improvement
Share your thoughts in the comments
Please Login to comment...