Scales of Measurement in Business Statistics
Last Updated :
15 Nov, 2023
What is Scales of Measurement?
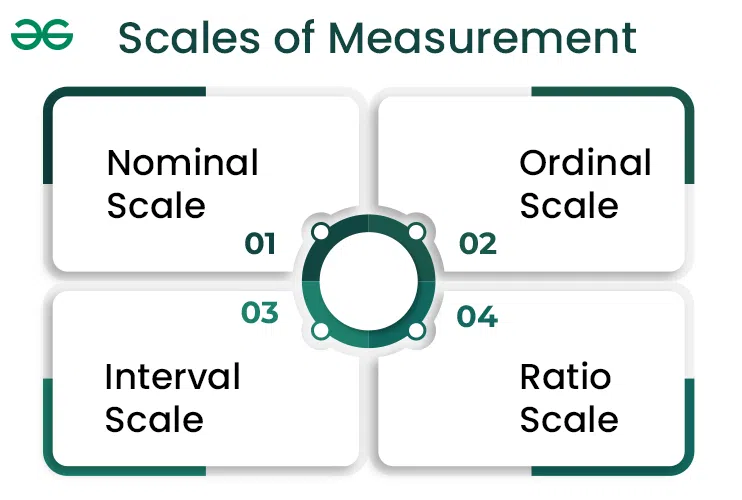
Scales of measurement, in the realm of statistics and research, serve as a crucial framework for understanding and categorising the various ways in which data can be quantified and analysed. There are four main scales of measurement: nominal, ordinal, interval, and ratio. Understanding the scale of measurement is essential for choosing the appropriate statistical analyses and drawing valid conclusions from data. Scales of Measurement are the sole determinants of the statistical operations that can be applied to the given data set. The choice of scale depends on the nature of the data and the research questions being addressed.
I. Nominal Scale
The nominal scale of measurement is the simplest level of measurement in statistics. It categorises data into distinct categories or labels, where each category represents a different attribute or group. Nominal data lacks any inherent order or ranking, and there are no meaningful numeric values associated with the categories. It is primarily used for classification and organising data into discrete groups. Nominal data is suitable in various situations when dealing with categorical or qualitative variables that can be divided into distinct, non-overlapping categories or groups.
Examples of Nominal Scale
- Gender: The categories of male, female, and non-binary represent a nominal scale. These categories are distinct, but there is no inherent order or numeric value associated with them.
- Types of Fruit: Categorising fruits into groups like apples, bananas, and oranges is another example. These categories are distinct and used for classification, but they do not represent any numeric values or ordering.
- Marital Status: Marital status categories such as single, married, divorced, and widowed are nominal. They classify individuals into different marital groups, but there is no inherent order among them.
Characteristics of Nominal Scale
- Mutually Exclusive Categories: Each data point can belong to only one category, and categories are mutually exclusive. For example, an individual cannot be both male and female simultaneously.
- No Inherent Order: The categories do not have a natural order or ranking. In the gender example, there is no inherent order among male, female, and non-binary.
- No Arithmetic Operations: Nominal data does not support meaningful mathematical operations like addition, subtraction, or multiplication. You cannot perform calculations like finding the average (mean) or taking the difference between categories.
- Mode as the Measure of Central Tendency: The most suitable measure of central tendency for nominal data is the mode, which simply identifies the most frequently occurring category.
II. Ordinal Scale
The ordinal scale of measurement is one of the four fundamental measurement scales in statistics, ranking just above the nominal scale in terms of measurement precision. This scale introduces an ordered relationship between categories, meaning that the data can be ranked or ordered in some meaningful way, but the intervals between the categories are not uniform or well-defined. It indicates relative differences in magnitude but lacks precise measurement. Ordinal data is suitable for descriptive purposes and can be analysed using non-parametric statistical techniques that do not require equal intervals or a true zero, such as ranking, median, and mode. However, caution should be exercised when performing arithmetic operations on ordinal data, as these operations are generally not meaningful.
Examples of Ordinal Scale
- Educational Levels: Educational attainment is often measured on an ordinal scale. For example, we can categorise individuals’ education levels as “High School,” “Bachelor’s Degree,” “Master’s Degree,” and “Ph.D.” These categories have a clear order, with each representing a higher level of education, but the intervals between them do not signify equal increases in knowledge or skills.
- Customer Satisfaction Ratings: Customer satisfaction surveys often use ordinal scales to collect feedback. Ratings like “Very Dissatisfied,” “Somewhat Dissatisfied,” “Neutral,” “Somewhat Satisfied,” and “Very Satisfied” provide an ordered ranking of satisfaction levels, but the difference in satisfaction between two adjacent categories may not be consistent.
- Star Ratings: Online reviews and rating systems often use ordinal scales. For example, a product or service might be rated on a scale of 1 to 5 stars, with 5 stars indicating the highest rating. While these stars represent a ranking, the difference in quality or satisfaction between, say, 3 and 4 stars may not be the same as between 4 and 5 stars.
Characteristics of Ordinal Scale
- Ordered Categories: Data on an ordinal scale is organised into categories that have a meaningful order or ranking. This means that one category is considered higher or lower than another category based on some inherent characteristic, but the exact difference between them is not specified.
- Unequal Intervals: Unlike interval and ratio scales, ordinal scales do not have consistent or equal intervals between categories. The intervals between categories are not standardised, and we cannot assume that the difference in magnitude between two adjacent categories is the same as the difference between other adjacent categories.
- No True Zero: Ordinal scales lack a true zero point, meaning that there is no absolute starting point or reference point at which the characteristic being measured is non-existent. This absence of a true zero limits the mathematical operations that can be performed on ordinal data.
III. Interval Scale
The interval scale is a level of measurement that combines the properties of both the nominal and ordinal scales but goes a step further by having equal intervals between data points. Unlike the nominal and ordinal scales, the interval scale assigns numerical values to categories and ensures that the intervals between these values are equal. However, it lacks a true zero point, meaning that the absence of a value does not imply the absence of the attribute being measured.
Examples of Interval Scale
- Temperature: Temperature measured in Degrees Celsius or Degrees Fahrenheit is a classic example of data measured on an interval scale. The intervals between degrees are consistent (e.g., the difference between 20°C and 30°C is the same as between 30°C and 40°C), but a temperature of 0°C does not mean the absence of temperature, it is just a reference point.
- IQ Scores: IQ (intelligence quotient) scores are measured on an interval scale. The differences between IQ scores are consistent, but an IQ score of 0 does not imply a total lack of intelligence.
Characteristics of Interval Scale
- Equal Intervals: In an interval scale, the intervals between values are uniform and consistent. For example, the difference between 20°C and 30°C is the same as between 30°C and 40°C.
- Ordered Data: Like the ordinal scale, data on the interval scale can be ordered or ranked. You can say that one temperature is higher or lower than another, or that one IQ score is higher or lower than another.
- No True Zero: Perhaps the most important characteristic of the interval scale is the absence of a true zero point. In other words, a value of zero does not indicate the complete absence of the attribute being measured. For example, a temperature of 0°C does not mean there is no temperature, it is just a reference point on the Celsius scale.
- Mathematical Operations: Mathematical operations like addition and subtraction can be performed on interval data. This allows for calculations of differences or changes between values. However, multiplication, division, and ratios are not meaningful because of the lack of a true zero.
- Measures of Central Tendency and Dispersion: Interval data can be used to calculate measures like the mean (average), median, mode, variance, and standard deviation. These statistical measures are valuable for analysing and summarising interval-scale data.
IV. Ratio Scale
The ratio scale of measurement is the most precise and comprehensive level of measurement in statistics. It possesses all the properties of the lower scales (nominal, ordinal, and interval) and includes a meaningful zero point, allowing for the calculation of meaningful ratios between values. This means that not only can data be ranked and have consistent intervals, but ratios between values are also meaningful. It is commonly used in scientific research, economics, engineering, and many other fields where precise measurement and data analysis are essential.
Examples of Ratio Scale
- Height: Height measured in centimeters or inches is an example of a ratio scale. It has a true zero point (i.e., the absolute absence of height), and one can perform meaningful mathematical operations. For instance, if one person is 180 cm tall and another is 90 cm tall, we can say that the first person is twice as tall as the second person.
- Weight: Weight measured in kilograms or pounds is another example of a ratio scale. It also has a true zero point, allowing for meaningful ratios. For instance, If one object weighs 10 kilograms and another weighs 5 kilograms, we can accurately say that the first object is twice as heavy as the second one.
- Age: Age in years is a ratio scale variable. It starts from zero at birth, and one can perform meaningful arithmetic operations with age. For instance, if someone is 40 years old and another person is 20 years old, we can say that the first person is twice as old as the second person.
- Income: Income measured in dollars is a ratio scale variable. It has a true zero point (earning zero dollars means having no income), and one can perform arithmetic operations on income data. For example, if one person earns ₹60,000 per year and another person earns ₹30,000 per year, we can state that the first person earns twice as much as the second person.
Characteristics of Ratio Scale
- True Zero Point: The defining characteristic of the ratio scale is the presence of a true zero point, which represents the complete absence of the measured attribute. This allows for the calculation of meaningful ratios (e.g., one value is twice as large as another).
- Equal Intervals: Like the interval scale, the ratio scale has equal intervals between values. This means that the numerical difference between any two values on the scale is meaningful and consistent.
- Order and Magnitude: The data on a ratio scale can be ordered or ranked based on magnitude, and meaningful comparisons can be made between values.
- Arithmetic Operations: All basic arithmetic operations (addition, subtraction, multiplication, division) can be applied to ratio scale data. This enables the calculation of various statistical measures such as the mean, median, mode, variance, standard deviation, and more.
- Meaningful Ratios: Ratios between values have practical significance. For instance, if you have two values on a ratio scale, you can accurately state how many times one value is greater or smaller than the other.
Share your thoughts in the comments
Please Login to comment...