What is Business Statistics?
Business Statistics is defined as the systematic practice of collecting, analysing, interpreting, and presenting data, relevant to business operations and decision-making. It serves as a critical tool for organisations to gain insights into their performance, market dynamics, and customer behaviour. By applying various statistical methods and techniques, businesses can uncover patterns, trends, and relationships within their data, enabling them to make informed decisions, set goals, and optimise processes.
According to Bowley, “Statistics is a science of averages.”
Key takeaways from Business Statistics-
- Business Statistics plays a crucial role in risk assessment, market research, quality control, and forecasting, helping companies stay competitive and adaptable in an increasingly data-centric business landscape.
- It empowers businesses to harness the power of data to enhance efficiency, minimise risks, and drive success.
Importance of Business Statistics
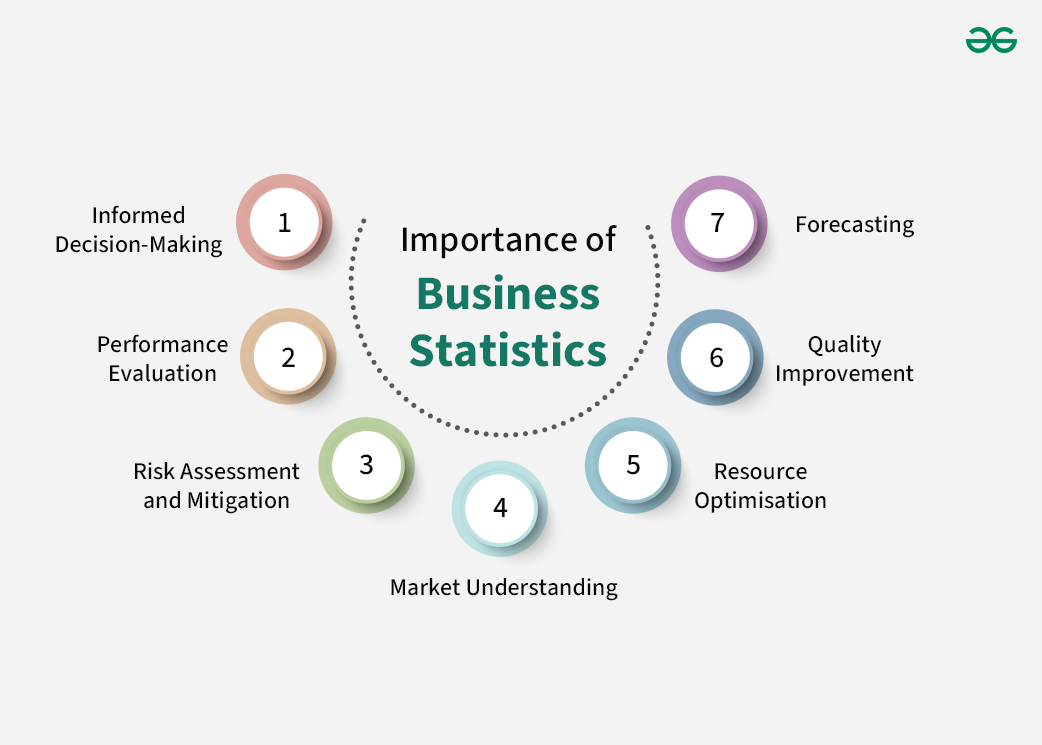
The importance of business statistics cannot be overstated in today’s data-driven business environment. Business statistics is essential for enhancing decision-making, optimising operations, managing risks, and staying competitive in the business landscape. It empowers organisations to harness the power of data to achieve their objectives and drive long-term success. Here are several key reasons why business statistics is crucial for organisations:
1. Informed Decision-Making: Business statistics provides the tools and techniques necessary to analyse data and extract valuable insights. This enables organisations to make informed decisions based on empirical evidence rather than relying on intuition or guesswork.
2. Performance Evaluation: It allows businesses to assess the performance of various aspects of their operations, such as sales, marketing, production, and finance. By measuring performance against established benchmarks and objectives, companies can identify areas for improvement.
3. Risk Assessment and Mitigation: Business statistics help in identifying and quantifying risks. By understanding the likelihood and potential impact of various risks, organisations can take proactive measures to mitigate them, enhancing their resilience and ability to adapt to changing circumstances.
4. Market Understanding: Companies can use statistics to gather and analyse data on market trends, consumer behaviour, and competition. This information is vital for developing effective marketing strategies, launching new products, and staying competitive.
5. Resource Optimisation: Statistics aids in optimising resource allocation, including budgeting, manpower, and inventory management.
6. Quality Improvement: Statistical quality control techniques help businesses monitor and enhance the quality of their products or services. By reducing defects and variations, companies can improve customer satisfaction and reduce waste.
7. Forecasting: Business statistics is essential for making accurate forecasts, whether it is predicting sales, demand for products, or financial trends. These forecasts are instrumental in planning and resource allocation.
Applications of Business Statistics
Business Statistics has a wide range of applications in various aspects of business operations and decision-making. Here are some key applications of business statistics:
1. A/B Testing: Digital marketing relies on A/B testing, a statistical method, to compare the effectiveness of different website designs, ad campaigns, and content variations to optimise conversion rates. It involves comparing two or more versions of a digital asset (the A and B variants) to determine which one performs better in achieving a specific goal, such as increasing click-through rates, conversions, or user engagement. Through rigorous statistical analysis, A/B testing enables businesses to make data-driven decisions about design changes, content variations, and marketing strategies, ultimately improving user experiences and maximising desired outcomes.
2. Econometrics: Econometrics is a specialised application of business statistics that focuses on applying statistical methods to economic data. It plays a crucial role in economics, finance, and policy analysis. Econometricians use statistical tools and models to study and quantify the relationships between economic variables, such as supply and demand, inflation and unemployment, or interest rates and economic growth. By analysing historical data and building econometric models, researchers and policymakers can make predictions, test economic theories, and evaluate the impact of various policies on the economy. Econometrics is essential for understanding and addressing complex economic issues, making it a vital field within the broader realm of business statistics.
3. Environmental Analysis: Environmental analysis, as an application of business statistics, plays a crucial role in assessing and mitigating environmental impacts on organisations. By employing statistical techniques, businesses can gather and analyse data related to environmental factors such as pollution levels, resource consumption, carbon emissions, and sustainability metrics. This information is essential for compliance with environmental regulations, minimising environmental risks, and adopting sustainable practices. Statistical analysis aids in identifying trends, assessing the effectiveness of environmental initiatives, and making informed decisions to reduce ecological footprints. It allows businesses to balance profitability with environmental responsibility, which is becoming increasingly important in a world focused on sustainability and corporate social responsibility.
4. Healthcare Management: Healthcare management is a crucial field where the application of business statistics plays a pivotal role in improving patient care, optimising resources, and ensuring the efficiency of healthcare organisations. In this context, statistics is used to analyse patient data, such as medical records and treatment outcomes, to identify trends, assess the effectiveness of medical interventions, and predict disease patterns. Healthcare managers rely on statistical tools for resource allocation, such as staffing levels, bed capacity, and equipment utilisation, ensuring that healthcare facilities can meet patient needs while controlling costs. Moreover, statistics aids in monitoring healthcare quality and patient satisfaction through surveys and feedback analysis, facilitating continuous improvement efforts. Ultimately, the application of business statistics in healthcare management contributes to better decision-making, higher quality care, and improved overall healthcare delivery.
5. Retail Analytics: This involves the systematic analysis of vast volumes of data generated by retail operations, including sales transactions, customer interactions, inventory levels, and more. By harnessing statistical methods, retailers can uncover valuable insights into consumer behaviour, optimise pricing strategies, and enhance overall business performance. Retail analytics helps retailers make data-driven decisions regarding inventory management, stock replenishment, store layout design, and marketing campaigns. Additionally, it allows for the identification of trends and patterns in customer preferences, enabling personalised marketing efforts that can boost sales and customer loyalty. Ultimately, retail analytics empowers retailers to adapt to changing market dynamics, maximise profitability, and provide a better shopping experience for customers.
6. Customer Satisfaction Surveys: Through carefully designed surveys and statistical analysis, businesses can measure customer satisfaction levels, identify areas of strength and weakness, and uncover valuable insights into customer preferences and expectations. Statistical methods help in summarising and interpreting survey data, enabling businesses to make data-driven decisions to enhance customer experiences, adjust product offerings, and refine customer service strategies. By continuously monitoring customer satisfaction through statistical surveys, organisations can not only retain existing customers but also attract new ones, ultimately contributing to long-term success and competitiveness in the market.
Examples of Business Statistics
Many companies across various industries leverage business statistical tools to gain insights, make informed decisions, and enhance their operations. Here are some examples of companies and how they use statistical tools:
1. Amazon: Amazon uses advanced statistical models to analyse customer browsing and purchasing behaviour. This data-driven approach helps them recommend products, optimise supply chain operations, and forecast demand.
2. Walmart: Walmart employs statistical analysis for inventory management and demand forecasting. By analysing historical sales data and trends, they can ensure that products are available when and where customers need them.
3. Google: Google utilises statistical algorithms for its search engine ranking system. These algorithms assess the relevance and quality of web pages to provide users with the most accurate search results.
4. Netflix: Netflix employs recommendation algorithms that rely on statistical methods to suggest movies and TV shows to its subscribers based on their viewing history and preferences.
5. Tesla: Tesla collects data from its electric vehicles to perform statistical analysis on vehicle performance, battery efficiency, and predictive maintenance. This data informs product improvements and service offerings.
6. Procter & Gamble: P&G uses statistical tools for quality control and new product development. They conduct experiments and statistical analysis to optimise product formulations and manufacturing processes.
7. Facebook: Facebook uses statistical analysis for ad targeting and content recommendations. Algorithms analyse user data to show relevant advertisements and content on the platform.
8. Delta Air Lines: Delta uses statistical models for revenue management and route planning. These models help optimise ticket pricing and flight scheduling to maximise profitability.
9. Ford Motor Company: Ford applies statistical analysis in designing and testing new vehicles. Statistical methods are used to analyse crash test data, vehicle performance, and customer feedback to improve vehicle safety and quality.
Limitations of Business Statistics
1. Data Quality Issues: Statistics heavily depend on the quality and accuracy of data. If data is collected with biases or contains errors, it can introduce significant distortions into the analysis, potentially leading to misleading results.
2. Sampling Errors: The size of the sample used in statistical analysis can impact the accuracy of results. A small sample may not be representative of the entire population, leading to skewed conclusions. The method used to select a sample can introduce biases. For instance, if a non-random sampling method is used, it may not accurately represent the population.
3. Assumptions and Simplifications: Statistical models often make simplifying assumptions about the data. If these assumptions do not hold in reality, the results can be misleading. For example, linear regression assumes a linear relationship between variables, which may not always be the case.
4. Causation vs. Correlation: Statistics can establish correlations between variables, but it cannot prove causation. Causation requires additional evidence and experimentation.
5. Historical Data: Statistics often rely on historical data, which may not accurately predict future events, especially in rapidly changing environments or markets.
6. Limited Scope: Statistics can only analyse data that has been collected. It may not account for factors that were not measured or considered, potentially leading to incomplete analyses.
7. Human Judgment: Interpreting statistical results involves human judgment. Different analysts may interpret the same data differently, leading to subjectivity and potential bias.
8. Overfitting: When fitting complex models to data, there is a risk of overfitting, where the model captures noise in the data rather than true patterns. This can lead to poor generalisation of new data.
9. Ethical and Privacy Concerns: Collecting and analysing data may raise ethical and privacy concerns, especially when dealing with sensitive information.
Types of Business Statistics
1. Descriptive Statistics: Descriptive statistics is a fundamental branch of statistics that focuses on summarising and presenting data in a meaningful and concise manner. It provides a snapshot of the main characteristics and features of a dataset, making complex information more understandable.
- Descriptive statistics includes measures such as the mean (average), median (middle value), mode (most frequent value), and measures of variability like the range and standard deviation.
- Additionally, it uses graphical representations such as histograms, bar charts, and scatter plots to visualise data distributions and relationships.
- Descriptive statistics are invaluable for simplifying large datasets and providing insights into their central tendencies, variations, and key trends. Whether in business, research, or everyday life, they help individuals and organisations make sense of data, make comparisons, and make informed decisions.
- By distilling complex data into manageable summaries, descriptive statistics serve as a critical tool for understanding and communicating information effectively.
2. Inferential Statistics: Inferential statistics is a branch of statistics that plays a vital role in concluding, making predictions, and gaining insights about populations or larger datasets based on the analysis of a smaller, representative sample. Its primary purpose is to generalise from sample data to make inferences or estimations about parameters, trends, and relationships within the entire population.
- Inferential statistics employs various techniques, such as hypothesis testing, confidence intervals, regression analysis, and analysis of variance, to make these inferences.
- These methods help determine whether observed differences or relationships in the sample data are statistically significant and can be generalised to the broader population.
- In practical terms, inferential statistics aids decision-makers in various fields, including business, healthcare, social sciences, and more.
- It enables us to assess the effectiveness of new treatments, predict consumer behaviour, gauge the impact of policies, and make data-driven decisions in situations where examining the entire population is often impractical or impossible.
- Properly conducted inferential statistics ensures that the insights drawn from sample data are both reliable and meaningful for informed decision-making.
How do Companies use Business Statistics?
Companies use business statistics in various ways to improve decision-making, optimise operations, and achieve their business objectives. Companies rely on business statistics to turn raw data into actionable insights, enabling them to adapt to changing market conditions, enhance competitiveness, and make informed decisions that drive business success. The specific applications of business statistics may vary depending on the industry and company objectives. Here are some common ways in which companies use business statistics:
1. Market Research and Customer Analysis
- Conducting surveys and data analysis to understand customer preferences, needs, and behaviour.
- Segmenting customers into distinct groups based on demographics, buying patterns, or other characteristics.
- Analysing market trends, competition, and potential opportunities.
2. Sales and Revenue Forecasting
- Predicting future sales and revenue based on historical data, market trends, and other relevant factors.
- Adjusting pricing, marketing, and inventory strategies based on sales forecasts.
3. Inventory Management
- Determining optimal inventory levels to meet customer demand while minimising carrying costs.
- Using statistical models to forecast demand and reorder points.
4. Quality Control and Process Improvement
- Monitoring and analysing production processes to ensure product quality and consistency.
- Identifying defects or issues and implementing corrective actions based on statistical analysis.
5. Financial Analysis and Risk Management
- Analysing financial data to assess the company’s financial health and performance.
- Managing financial risks through techniques like variance analysis and sensitivity analysis.
6. Human Resources and Workforce Management
- Making hiring decisions based on data-driven assessments of candidates.
- Evaluating employee performance and identifying areas for training and improvement.
- Managing workforce diversity and inclusion through data analysis.
7. Marketing and Advertising Optimisation
- Measuring the effectiveness of marketing campaigns using Key Performance Indicators (KPIs) and metrics.
- A/B testing and multivariate testing to optimise marketing strategies.
8. Supply Chain and Operations Optimisation
- Analysing supply chain data to optimise procurement, logistics, and distribution processes.
- Reducing lead times, improving efficiency, and minimising costs through statistical analysis.
9. Customer Relationship Management (CRM)
- Tracking customer interactions and using data analytics to personalise marketing and sales efforts.
- Identifying and targeting high-value customers for retention and upselling.
10. Risk Assessment and Compliance
- Assessing and managing various types of risks, including financial, operational, and compliance risks.
- Ensuring regulatory compliance through data analysis and reporting.
11. Strategic Decision-Making
- Using statistical models and data analysis to support strategic decisions, such as market expansion, product development, and mergers/acquisitions.
- Scenario analysis to evaluate potential outcomes and risks associated with different strategies.
12. Energy and Resource Efficiency
- Monitoring energy consumption and resource usage to identify areas for cost reduction and sustainability improvements.
- Implementing data-driven strategies for energy efficiency and environmental sustainability.
13. Customer Feedback and Satisfaction:
- Collecting and analysing customer feedback and satisfaction surveys to make improvements in products and services.
- Identifying and addressing customer complaints and issues promptly.
Difference Between Business Statistics, Business Analytics, and Statistics
|
Basis
|
Business Statistics
|
Business Analytics
|
Statistics
|
|
Focus
|
Application of statistics to business problems. |
Use of data analysis to make informed business decisions. |
Study of data, its collection, analysis, and interpretation. |
|
Purpose
|
To provide tools for summarising and analysing business data. |
To extract actionable insights from data to support decision-making. |
To understand and describe data, often without a specific business context. |
|
Application Areas
|
Marketing research, sales forecasting, quality control, etc. |
Predictive modelling, data mining, machine learning, optimisation, etc. |
Purely academic and scientific; used in various fields, including business. |
|
Techniques
|
Descriptive statistics, hypothesis testing, regression, etc. |
Advanced statistical methods, machine learning algorithms, data visualisation, etc. |
Wide range of statistical methods, including experimental design and probability theory. |
|
Decision-making level Supports
|
Supports operational and tactical decision-making in business. |
Supports strategic, operational, and tactical decision-making. |
Academic research and decision-making across various domains. |
|
Tools and Software
|
May use statistical software like SPSS, Excel, or specialised business statistics software. |
Utilises a variety of tools, including programming languages (Python, R), data visualisation tools, and analytics platforms. |
Employs statistical software and tools based on specific statistical methods. |
Share your thoughts in the comments
Please Login to comment...