Overlay Histogram with Fitted Density Curve in R
Last Updated :
17 Jun, 2021
In this article, we will be looking at the different approaches to overlay histogram with fitted density curve in R programming language.
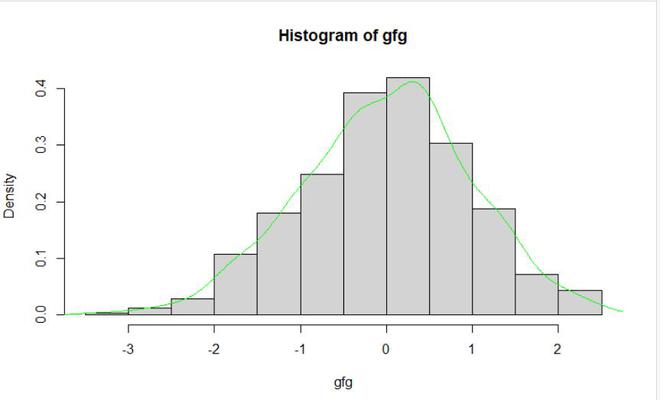
Method 1: Using line() and density() functions
In this approach for overlaying histogram with the fitted density curve user need not install or import any library as all the function are the base functions of the R programming language programming the user first needs to call the hist() functions for plotting the histogram with the given data, and further with that use lines() function with the combination of the density() function it will lead to the density curve fitted to the plotted histogram on the same plot in the R programming language.
hist() is a generic function hist computes a histogram of the given data values.
Syntax: hist(x, breaks = “Sturges”, freq = NULL, probability = !freq, include.lowest = TRUE, right = TRUE, density = NULL, angle = 45, col = NULL, border = NULL, main = paste(“Histogram of” , xname), xlim = range(breaks), ylim = NULL, xlab = xname, ylab, axes = TRUE, plot = TRUE, labels = FALSE, nclass = NULL, warn.unused = TRUE, …)
lines() is a generic function taking coordinates given in various ways and joining the corresponding points with line segments.
Syntax: lines(x, …)
density() is a generic function density that computes kernel density estimates.
Syntax: density(x,…)
Example:
R
gfg <-rnorm(500)
hist(gfg, prob = TRUE)
lines(density(gfg), col = "green")
|
Output:
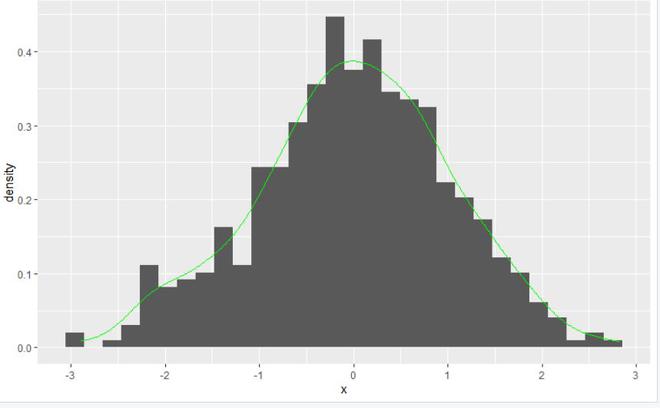
Method 2: Using geom_histogram() and geom_density() function
In this method to overlay the histogram with the fitted density curve, the user first needs to install and import the ggplot2 package in the R console, and call the ggplot() function which will create the plot of the given data with the required parameters and add the geom_histogram() to create the histogram of the data with the combination of geom_density() function which will be plotting the density curve on that plot with the histogram in the R programming language.
geom_histogram() function is used to create the histogram in ggplot of the given data.
Syntax: geom_histogram(mapping = NULL, data = NULL, stat = “bin”, position = “stack”, …)
geom_density() function computes and draws kernel density estimate, which is a smoothed version of the histogram.
Syntax:
geom_density(mapping = NULL, data = NULL, stat = “density”, position = “identity”, …, na.rm = FALSE, orientation = NA, show.legend = NA,inherit.aes = TRUE, outline.type = “upper”)
Example:
R
library("ggplot2")
gfg <-data.frame(x=rnorm(500))
ggplot(gfg, aes(x)) +geom_histogram(aes(y = stat(density))) +
geom_density(col = "green")
|
Output:
Share your thoughts in the comments
Please Login to comment...