Add Count and Percentage Labels on Top of Histogram Bars in R
Last Updated :
30 Jun, 2021
A histogram denotes the frequencies or contingency of values of the specified variable segregated into ranges. It groups the values into continuous ranges. Each bar of the histogram is used to denote the height, that is the number of values present in that specific range.
The hist() method in base R is used to display a histogram of the given data values. It takes as input a vector of the data values and outputs a corresponding histogram for the same.
Syntax:
hist ( x , labels)
Parameter :
- x – The set of data points to plot
- labels – By default, FALSE. If true, it is used to denote a set of counts on the top of bars. It can also take a function , a character or numeric vector .
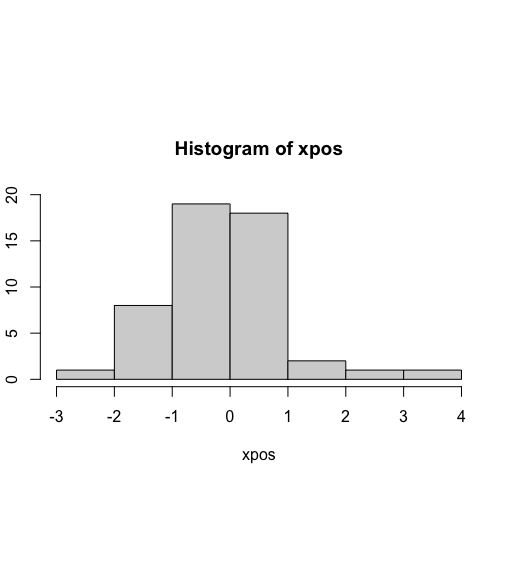
Let us first create a regular histogram so that the difference is apparent.
Example:
R
set.seed(67832)
xpos <- rnorm(50)
hist(xpos , ylim=c(0,20))
|
Output
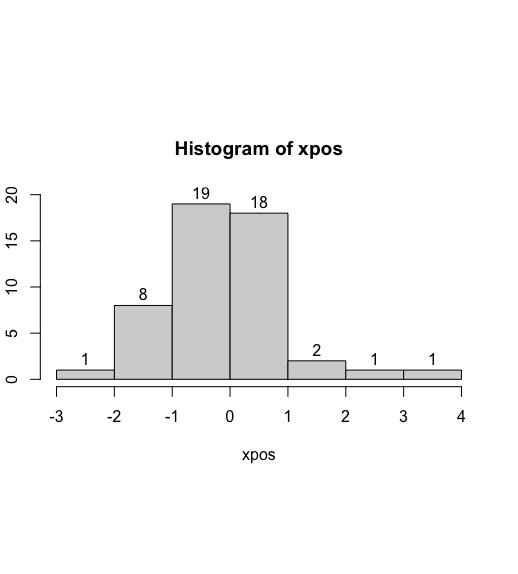
In order to compute the counts of the number of values encountered in each range, the labels attribute can be set to TRUE.
Syntax:
hist(…, labels=TRUE,..)
Example:
R
set.seed(67832)
xpos <- rnorm(50)
hist(xpos , labels = TRUE, ylim=c(0,20))
|
Output
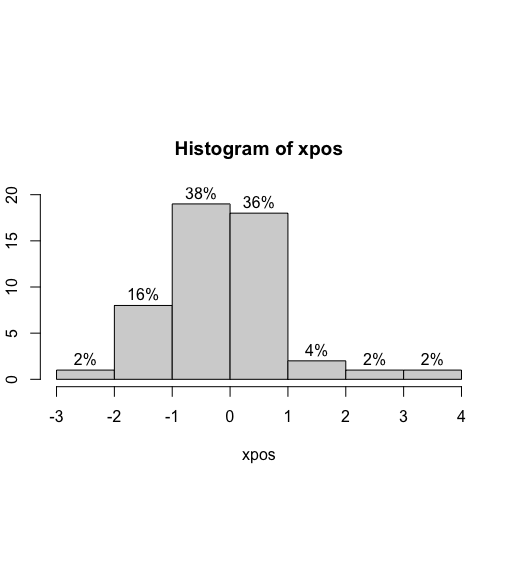
The percentage can be computed using mathematical functions. Initially, the histogram without any labels is stored in a variable. Its counts can be accessed using the counts attribute of the extracted histogram variable. This returns an integer vector of values each of which is divided by the length of the input data vector. These values are multiplied by 100 to turn into decimal values.
The decimal values can be rounded off to a specific number of digits using the round() method in R programming language.
Syntax:
round(num , digits)
The paste0() method can be used to concatenate values together and append a “%” sign to the corresponding values. In this method, the separator is an empty string by default.
Syntax:
paste0(val , “%”)
Example:
R
set.seed(67832)
xpos <- rnorm(50)
len <- length(xpos)
hist_init <- hist(xpos, plot = FALSE)
rounded <- round(hist_init$counts / len * 100, 2)
hist(xpos,
labels = paste0(rounded , "%"), ylim=c(0,20))
|
Output
Like Article
Suggest improvement
Share your thoughts in the comments
Please Login to comment...