Extract Frequency Counts from Histogram in R
Last Updated :
06 Jun, 2021
A histogram is basically used to represent data provided in a form of some groups. It is an accurate method for the graphical representation of numerical data distribution. It is a type of bar plot where the X-axis represents the bin ranges while the Y-axis gives information about frequency.
We can extract Frequency Counts of Histogram using hist() Function in R programming language. hist() function is used to plot a histogram out of the given data.
Syntax: hist(v, main, xlab, xlim, ylim, breaks, col, border)
Parameters:
- v: This parameter contains numerical values used in histogram.
- main: This parameter main is the title of the chart.
- col: This parameter is used to set color of the bars.
- xlab: This parameter is the label for horizontal axis.
- border: This parameter is used to set border color of each bar.
- xlim: This parameter is used for plotting values of x-axis.
- ylim: This parameter is used for plotting values of y-axis.
- breaks: This parameter is used as width of each bar.
Let us first plot a histogram so that values can be understood in detail. A histogram will need certain data to work upon and firstly that should be created, Then the data along with the required parameter should be passed to hist() method.
Example:
R
set.seed(56438)
x <- rnorm(200)
hist_vec <- hist(x)
|
Output:
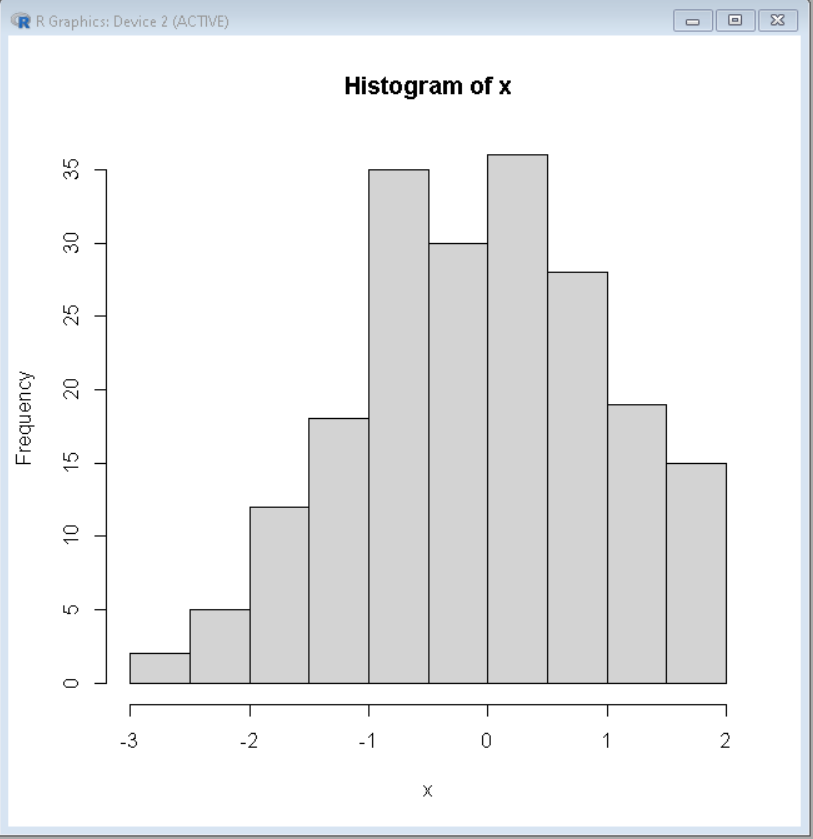
Histogram
Now to extract the number of occurrences of each element or count or frequency of each element out of this histogram, the count attribute of the hist() function will be used. The histogram should be saved to a variable and later out of that variable count should be extracted using the dollar sign($).
Syntax:
histogram$count
This will generate a vector that will contain the frequency of each element.
Example:
R
set.seed(56438)
x <- rnorm(200)
hist_vec <- hist(x)
frequency <- hist_vec$counts
frequency
|
Output:
[1] 2 5 12 18 35 30 36 28 19 15
Like Article
Suggest improvement
Share your thoughts in the comments
Please Login to comment...