Outlier Analysis in R
Last Updated :
01 Aug, 2023
This article will focus on the outlier analysis, including Outlier detection and removal in the R programming language.
What are outliers?
Data points far from the dataset’s other points are considered outliers. This refers to the data values dispersed among other data values and upsetting the dataset’s general distribution.
Outlier detection is a statistical approach used to find outliers in datasets. Measurement errors, incorrect data entry, or really anomalous data values are just a few of the causes of outliers.
Effects of an outlier on the model:
- The format of the data appears to be skewed.
- Modifies the mean, variance, and other statistical characteristics of the data’s overall distribution.
- Leads to the model’s accuracy level being biased.
Steps involving Outlier detection:
Step 1: In this step, we will be, by default creating the data containing the outliner inside it using the rnorm() function and generating 500 different data points. Further, we will be adding 10 random outliers to this data.
R
data <- rnorm(500)
data[1:10] <- c(46,9,15,-90,
42,50,-82,74,61,-32)
|
Step 2: In this step, we will be analyzing the outliner in the provided data using the boxplot, which will be plotting a barplot, and we will be able to analyze the outlier in the data. As said when reviewing a box plot, an outlier is defined as a data point that is located outside the whiskers of the box plot.
boxplot() function:
Boxplots are created by using the boxplot() function in the R programming language.
Syntax: boxplot(x, data, notch, varwidth, names, main)
Parameters:
- x: This parameter sets as a vector or a formula.
- data: This parameter sets the data frame.
- notch: This parameter is the label for horizontal axis.
- varwidth: This parameter is a logical value. Set as true to draw width of the box proportionate to the sample size.
- main: This parameter is the title of the chart.
- names: This parameter are the group labels that will be showed under each boxplot.
R
data <- rnorm(500)
data[1:10] <- c(46,9,15,-90,
42,50,-82,74,61,-32)
boxplot(data)
|
Output:
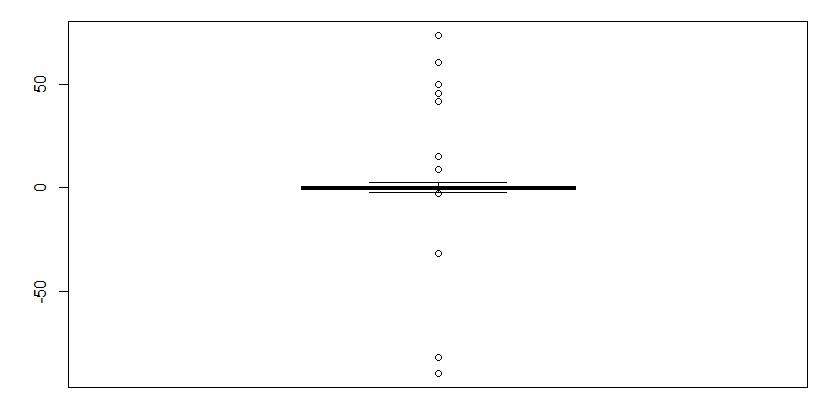
Outlier Detection
Step 3: In this step, we will remove the outlier of the provided data boxplot.stats() function in R; the same illustration is shown in the below code.
R
data <- data[!data %in% boxplot.stats(data)$out]
|
Step 4: In this step, we will just verify if the outliner has been removed from the data simply by plotting the boxplot as done in step 2 and verifying it accordingly.
R
data <- rnorm(500)
data[1:10] <- c(46,9,15,-90,42,50,-82,74,61,-32)
data <- data[!data %in% boxplot.stats(data)$out]
boxplot(data)
|
Output:
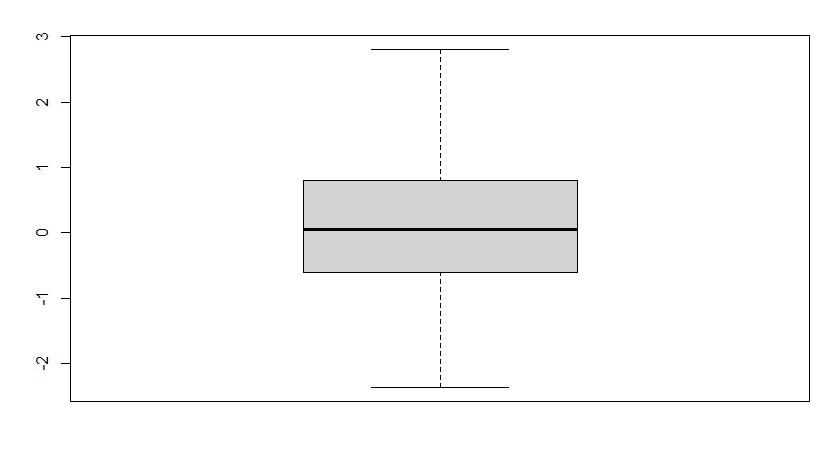
Outlier Detection
As we can see in the output plot that there is no outlier plotted in the plot. so, we successfully analyze and remove the outlier.
Histogram function:
Here we created a histogram by using the Histogram function in the R programming language to detect outliers.
R
set.seed(123)
data <- c(rnorm(1000), 10, 15, 12, 100)
hist(data)
|
Output:
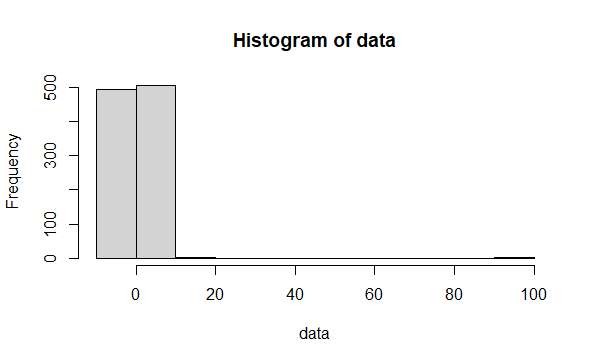
Outlier Detection
Detect and remove outliers from multiple columns in the R dataframe:
To detect and remove outliers from a data frame, we use the Interquartile range (IQR) method. This method uses the first and third quantile values to determine whether an observation is an outlier to not. If an observation is 1.5 times the interquartile range greater than the third quartile or 1.5 times the interquartile range less than the first quartile it is considered an outlier.
R
sample_data <- data.frame(x=c(1, 2, 3, 4, 3, 12, 3, 4, 4, 15, 0),
y=c(4, 3, 25, 7, 8, 5, 9, 77, 6, 5, 0),
z=c(1, 3, 2, 90, 8, 7, 0, 48, 7, 2, 3))
print("Display original dataframe")
print(sample_data)
boxplot(sample_data)
|
Output:
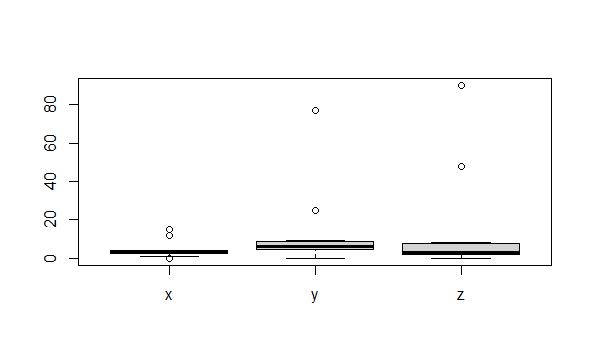
Outliers Detection
Remove outliers using IQR method.
R
detect_outlier <- function(x) {
Quantile1 <- quantile(x, probs=.25)
Quantile3 <- quantile(x, probs=.75)
IQR = Quantile3-Quantile1
x > Quantile3 + (IQR*1.5) | x < Quantile1 - (IQR*1.5)
}
remove_outlier <- function(dataframe,
columns=names(dataframe)) {
for (col in columns) {
dataframe <- dataframe[!detect_outlier(dataframe[[col]]), ]
}
print("Remove outliers")
print(dataframe)
}
remove_outlier(sample_data, c('x', 'y', 'z'))
|
Output:
  x y z
1 1 4 1
2 2 3 3
5 3 8 8
7 3 9 0
9 4 6 7
Here we are removing the outliers from multiple columns in R.
Share your thoughts in the comments
Please Login to comment...