Social Network Analysis Using R Programming
Last Updated :
01 Jun, 2020
Social Network Analysis (SNA) is the process of exploring or examining the social structure by using graph theory. It is used for measuring and analyzing the structural properties of the network. It helps to measure relationships and flows between groups, organizations, and other connected entities.
Before we start let us see some network analysis terminology
- A network is represented as a graph, which shows links (if any) between each vertex (or node) and its neighbors.
- A line indicating a link between vertices is called an edge.
- A group of vertices that are mutually reachable by following edges on the graph is called a component.
- The edges followed from one vertex to another are called a path.
The following software is required in order to perform network analysis
- R software
- Packages:
- igraph
- sna (social network analysis)
Functions used in the Social Network Analysis
- library() function
library() function load and attach add-on packages.
Syntax:
library(package, help, logical.return = FALSE....)
- make_full_graph() function
This function is used to create a full graph.
Syntax:
make_full_graph(n, loops = FALSE, directed = FALSE)
- make_ring() function
A ring is a one-dimensional lattice and it can create lattices of arbitrary dimensions, periodic or non-periodic ones.
Syntax:
make_ring(n, directed = FALSE, circular = TRUE, mutual = FALSE)
- make_star() function
This Function creates a star graph, where every single vertex is connected to the center vertex and nobody else.
Syntax:
make_star(n, center = 1, mode = c("in", "out", "mutual", "undirected"))
- sample_gnp() function
This is a simple model where every possible edge is created with the same constant probability.
Syntax:
sample_gnp(n, p, loops = FALSE, directed = FALSE)
- plot() function
This function is used to draw the given graph in the active graphics window.
Syntax:
plot(defined_graph_name)
Creating Sample Graphs
Full Graph
Syntax:
make_full_graph ()
Parameters:
- Number of vertices.
- directed = TRUE/FALSE Whether to create a directed graph or not.
- loops = TRUE/FALSE Whether to add self-loops to the graph or not.
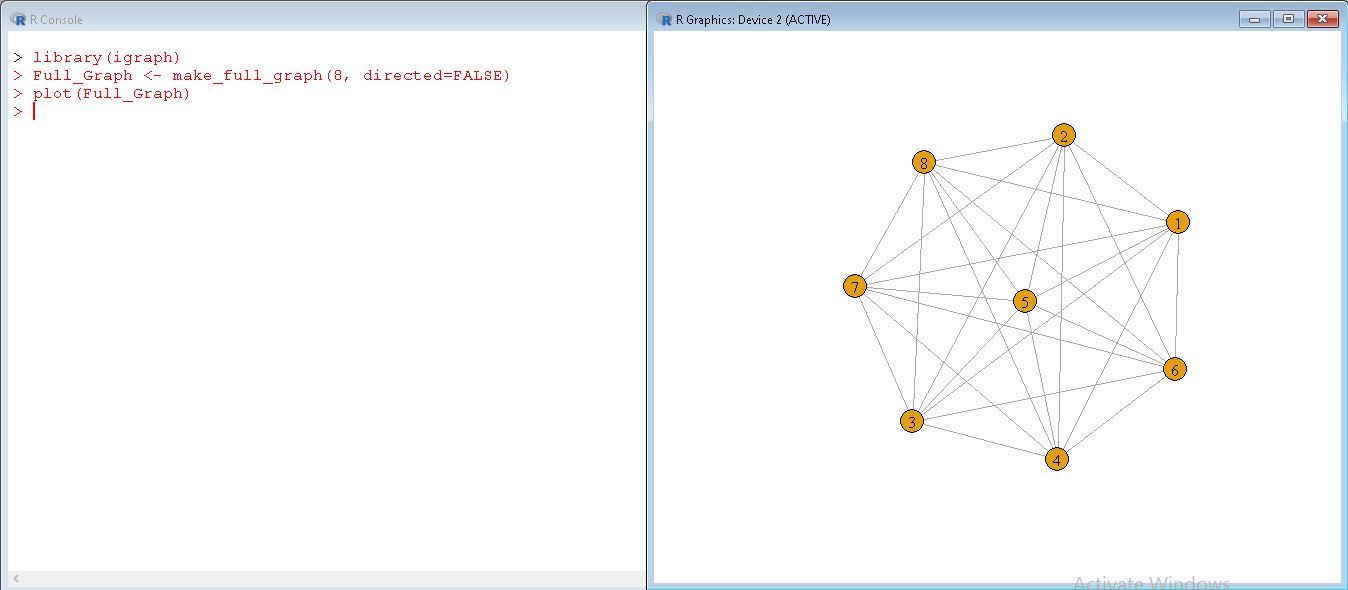
Example:
library(igraph)
Full_Graph <- make_full_graph(8, directed = FALSE)
plot(Full_Graph)
|
Output:
Ring Graph
The Ring graph is a one-dimensional lattice and is a special case of make_lattice function.
Syntax:
make_ring ()
Parameters:
- Number of vertices.
- directed = TRUE/FALSE Whether to create a directed graph or not.
- mutual =TRUE/FALSE Whether directed edges are mutual or not. It is ignored in undirected graph.
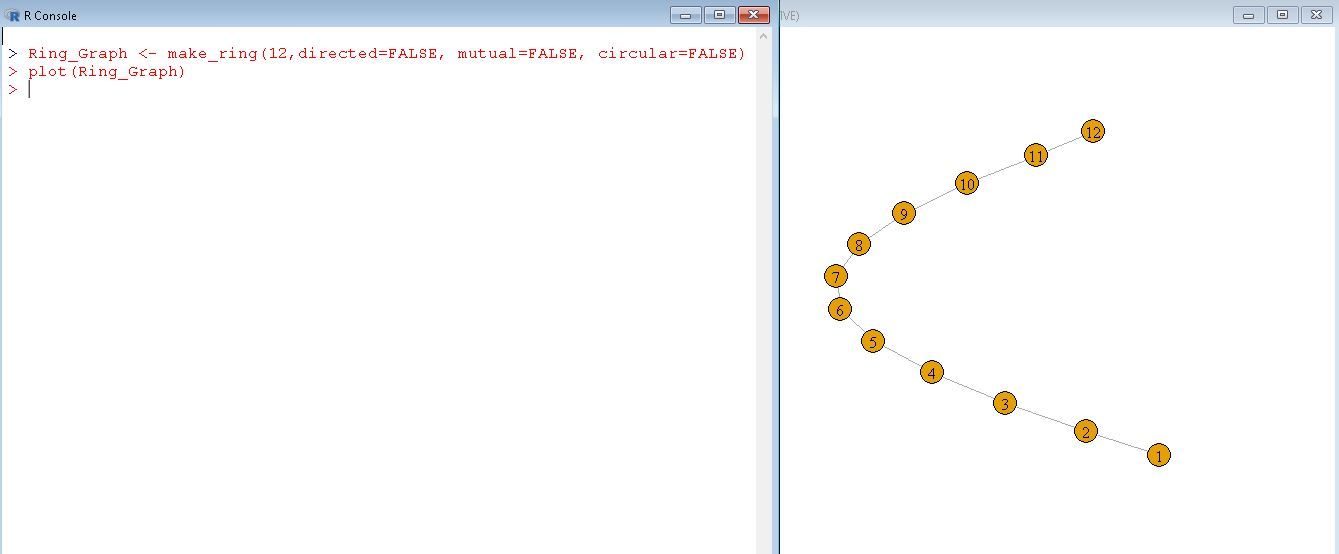
- circular =TRUE/FALSE Whether to create circular ring.
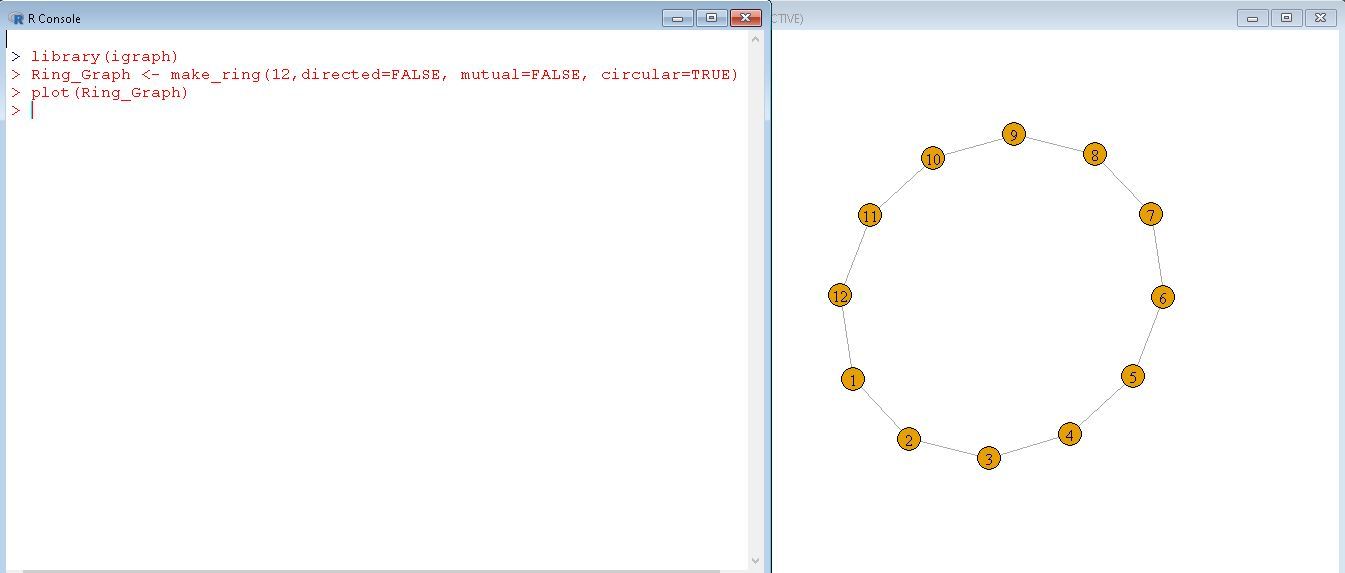
Example:
library(igraph)
Ring_Graph <- make_ring(12, directed = FALSE, mutual = FALSE, circular = TRUE)
plot(Ring_Graph)
|
Output:
Star Graph
A star graph is where every single vertex is connected to the center vertex and nobody else.
Syntax:
make_star()
Parameters:
- Number of vertices
- center = Id of the center vertex
- mode = It defines direction of the edges in/out/mutual/undirected.
- in – The edges point to the center.
- out – The edges point from the center.
- mutual – A directed star graph is created with mutual edges.
- undirected – The edges are undirected.
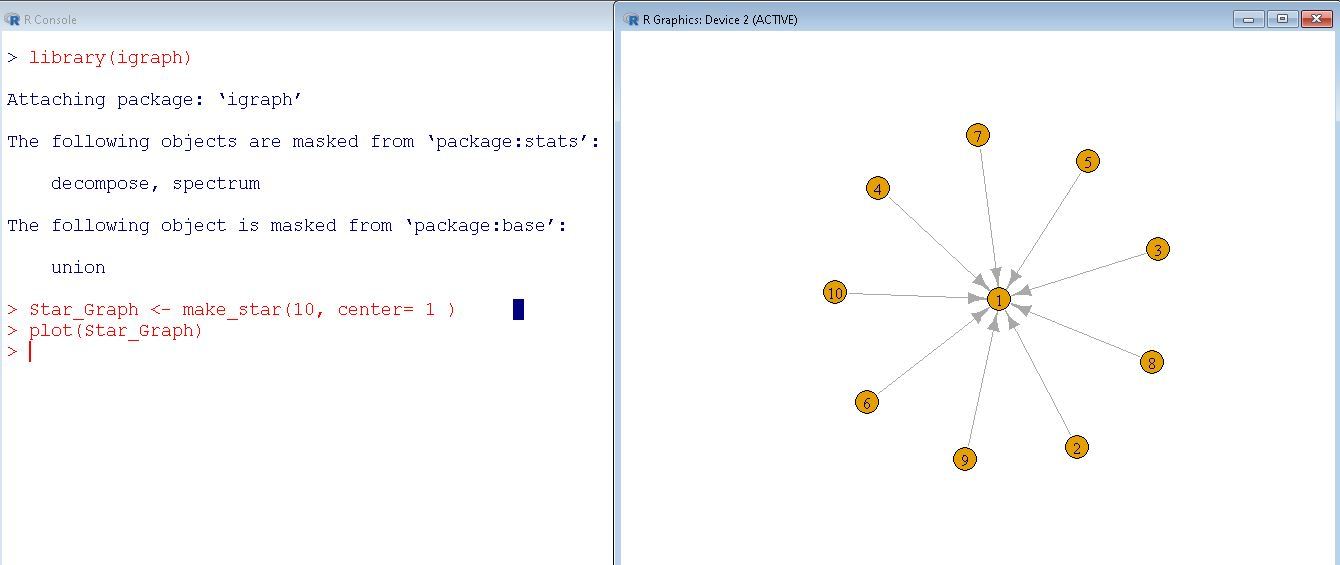
Example:
library(igraph)
Star_Graph <- make_star(10, center = 1)
plot(Star_Graph)
|
Output:
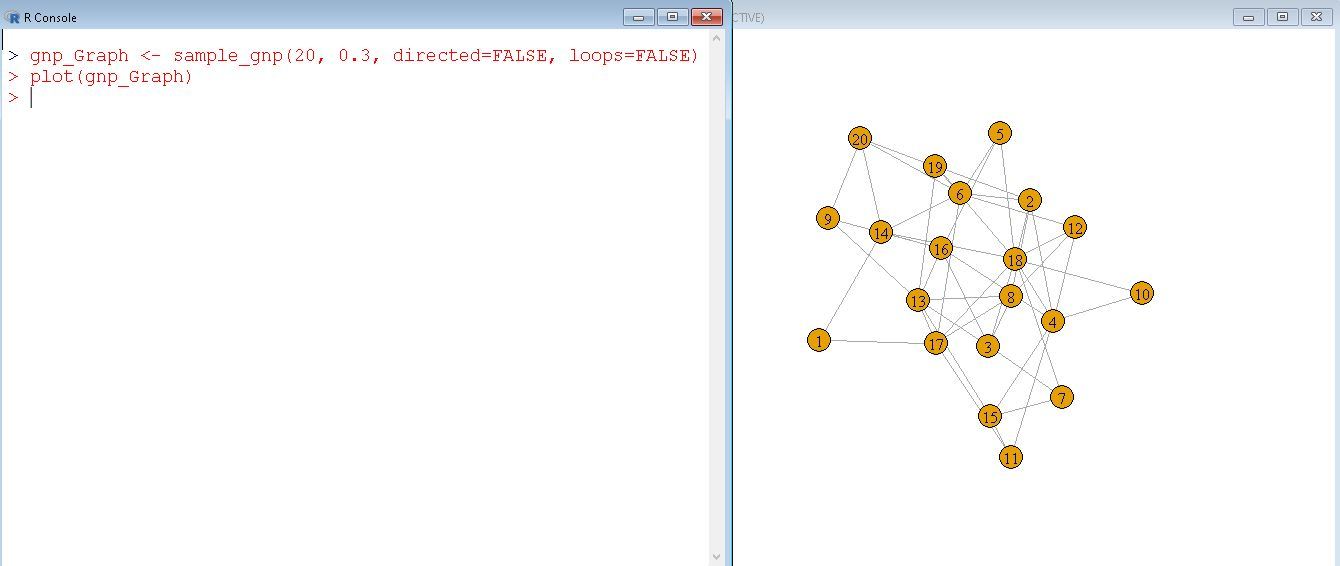
Generate random graphs (gnp)
The graphs below are randomly generated with a given constant probability to create an edge.
Syntax:
sample_gnp()
Parameters:
- Number of vertices in graph
- probability of drawing an edge between random vertices
- directed = FALSE/TRUE
- loops = FALSE/TRUE
Example:
library(igraph)
gnp_Graph <- sample_gnp(20, 0.3, directed = FALSE, loops = FALSE)
plot(gnp_Graph)
|
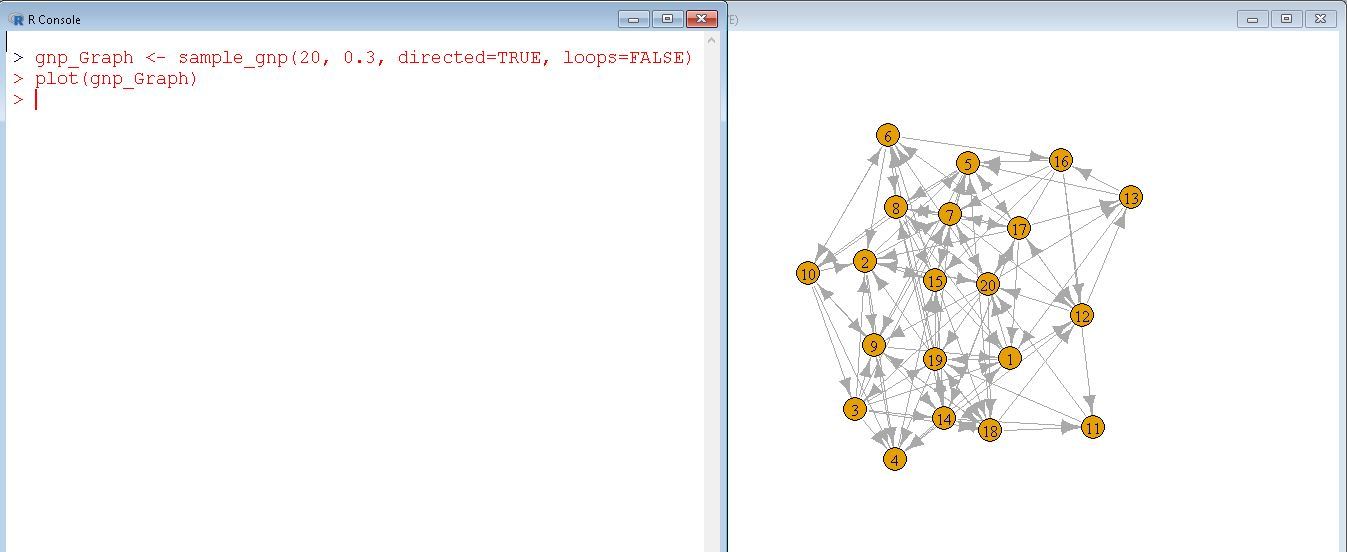
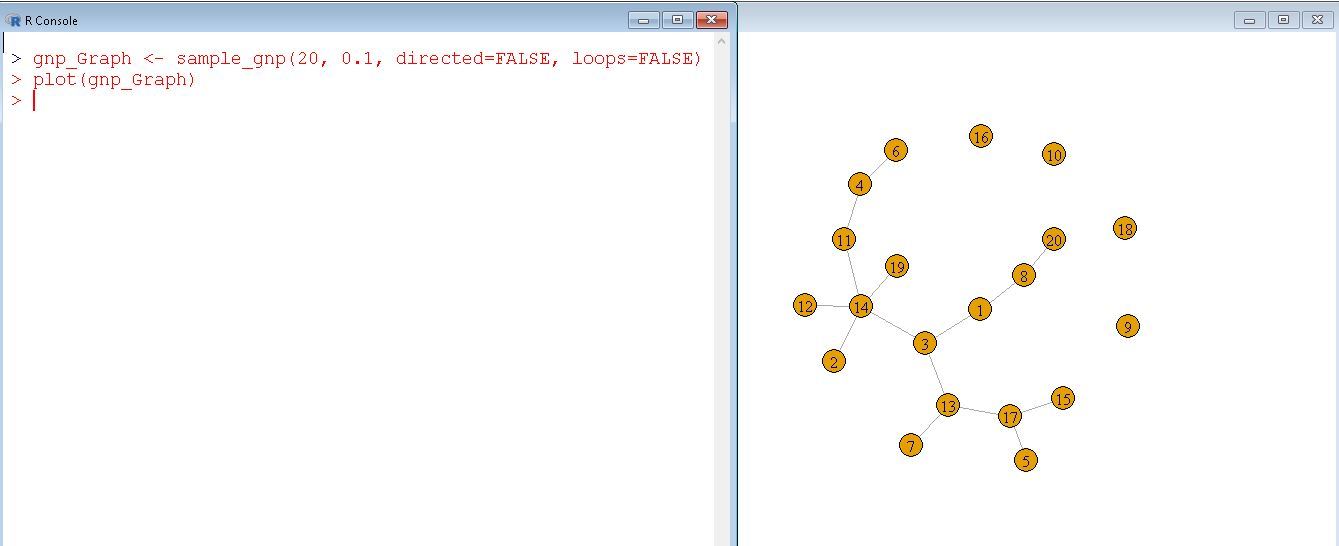
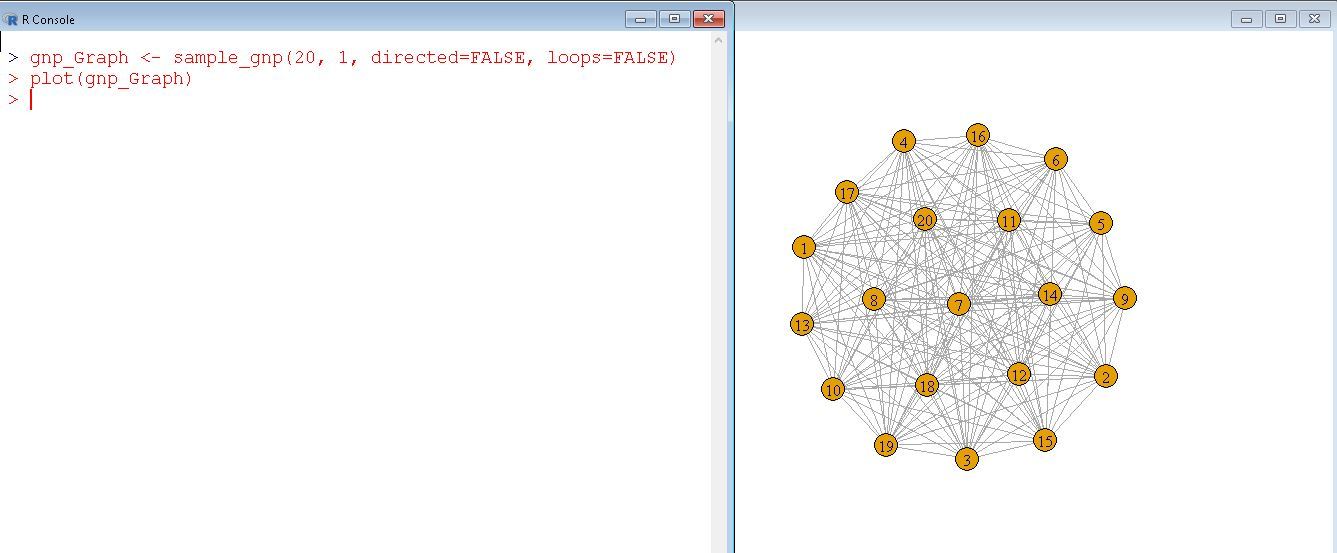
Similarly, you can try different graphs by changing their arguments as done below.
Output :
Analyzing graphs
Connectedness of graph
One of the basic measures of the vertices in a graph is how many connections they have with other vertices. This measure can either be the number of connections to the total possible connections also called density.
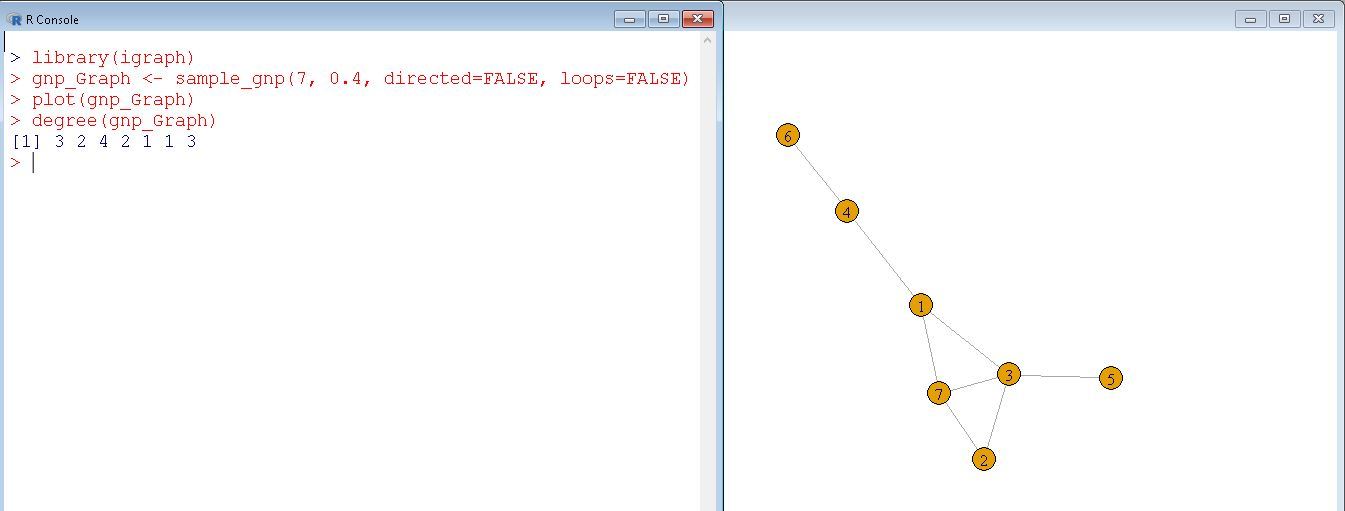
Now let us find the degree of each node/vertex in a random graph.
Syntax:
degree(graph)
The degree function is used to find out the number of vertices does each vertex is connected to.
Example:
library(igraph)
gnp_Graph <- sample_gnp(7, 0.4, directed = FALSE, loops = FALSE)
plot(gnp_Graph)
degree(gnp_Graph)
|
Output:
Betweenness of graph
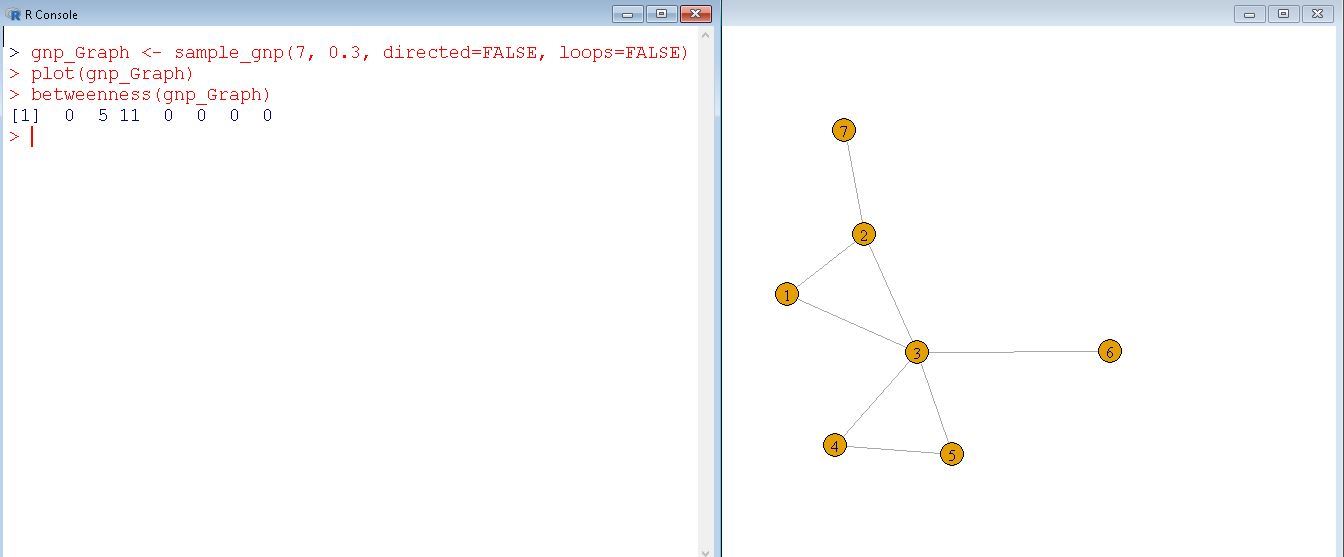
In social networks, betweenness is defined as bridges between and among groups of network members. One way to calculate the betweenness is to calculate the betweenness of each vertex. In general, the higher the betweenness score associated with a vertex, the more control over the network.
Syntax:
betweenness(graph)
betweenness() function is defined by the number of shortest paths going through a vertex or an edge.
Example:
library(igraph)
gnp_Graph <- sample_gnp(7, 0.4, directed = FALSE, loops = FALSE)
plot(gnp_Graph)
betweenness(gnp_Graph)
|
Output:
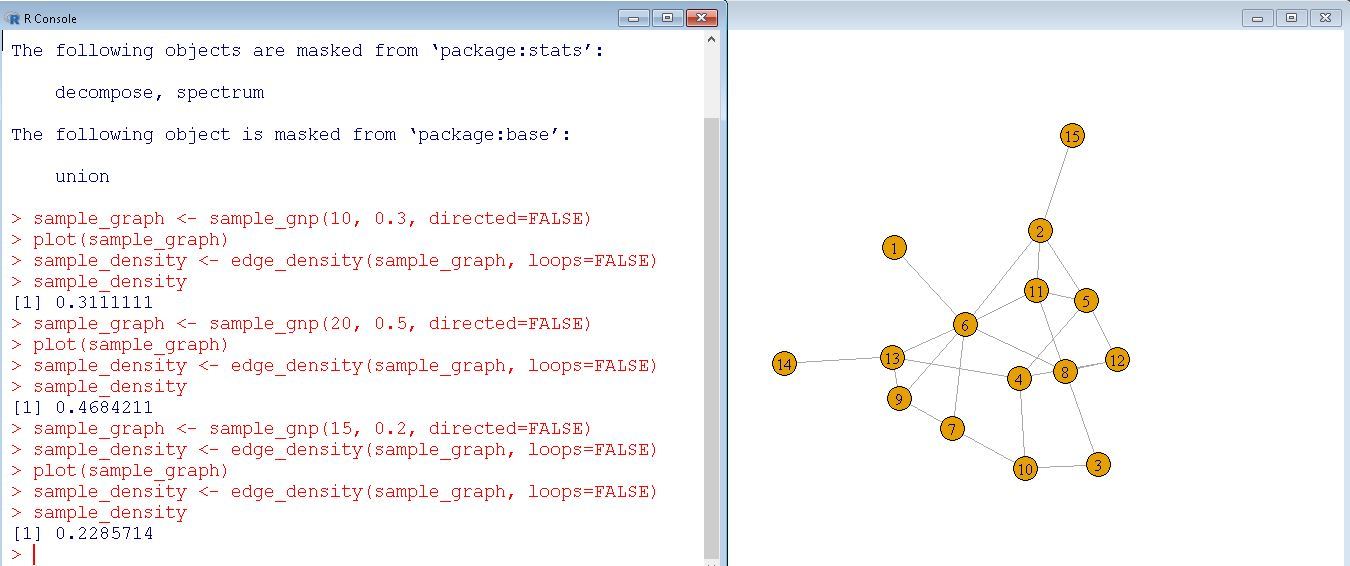
Network Density
The Network’s density is defined as the number of connections to the total number of possible connections. A complete graph has density = 1 while other networks can have a decimal value.
Syntax:
edge_density(graph)
It is the ratio of the number of edges to the total number of possible edges.
Example:
library(igraph)
sample_graph <- sample_gnp(10, 0.3, directed = FALSE)
plot(sample_graph)
sample_density <- edge_density(sample_graph, loops = FALSE)
sample_density
|
Output:
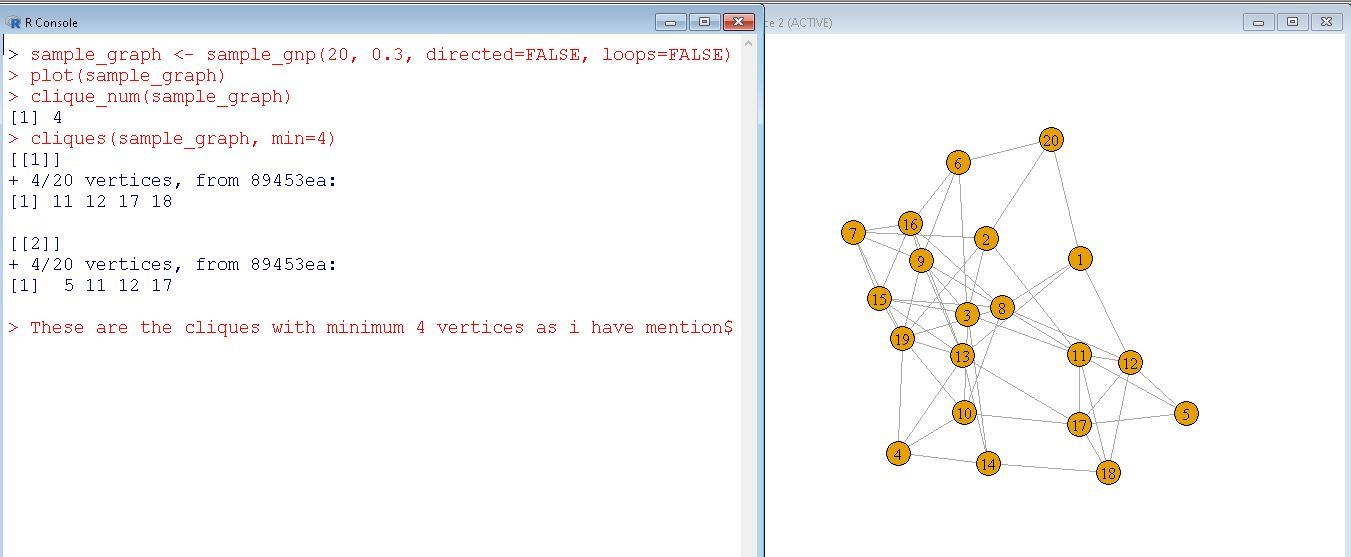
Identifying cliques in a network
A clique can be defined as a group of vertices where all possible links are present.
Syntax:
cliques(graph, min=NULL,max=NULL)
This function finds all the largest or maximal cliques in an undirected graph.
Example:
library(igraph)
sample_graph <- sample_gnp(20, 0.3, directed = FALSE, loops = FALSE)
plot(sample_graph)
clique_num(sample_graph, min=4)
|
Output:
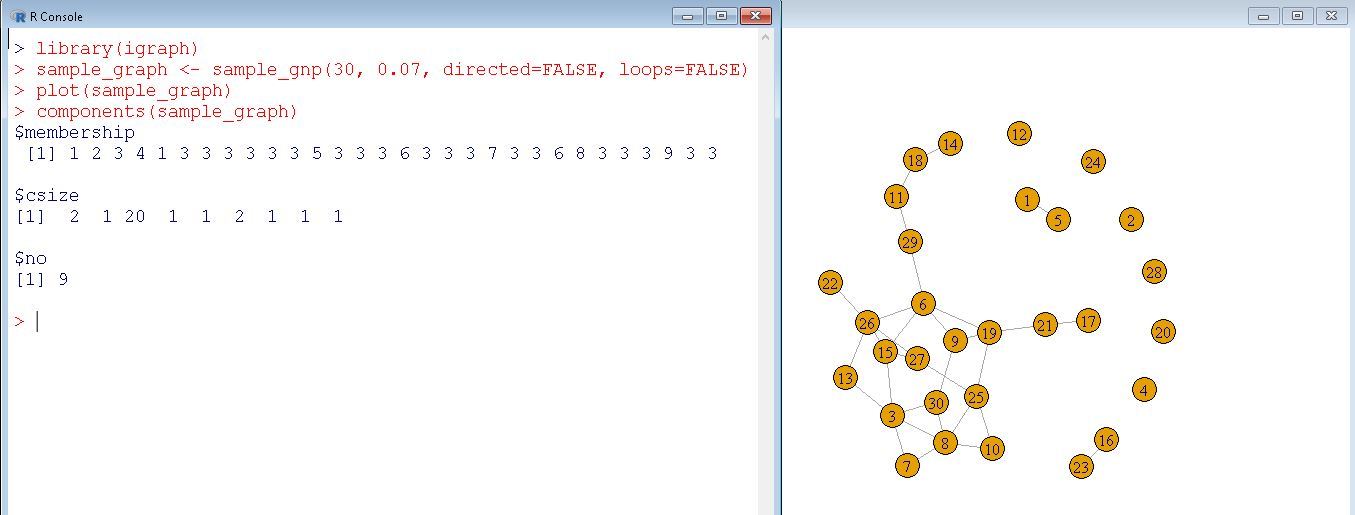
Finding components of a graph
A group of connected network vertices is called a component. So it’s possible that a can have multiple components that aren’t interconnected.
Syntax:
components(graph)
This will calculate the strongly or weakly connected components of a graph.
Example:
library(igraph)
sample_graph <- sample_gnp(30, 0.07, directed = FALSE, loops = FALSE)
plot(sample_graph)
components(sample_graph)
|
Output:
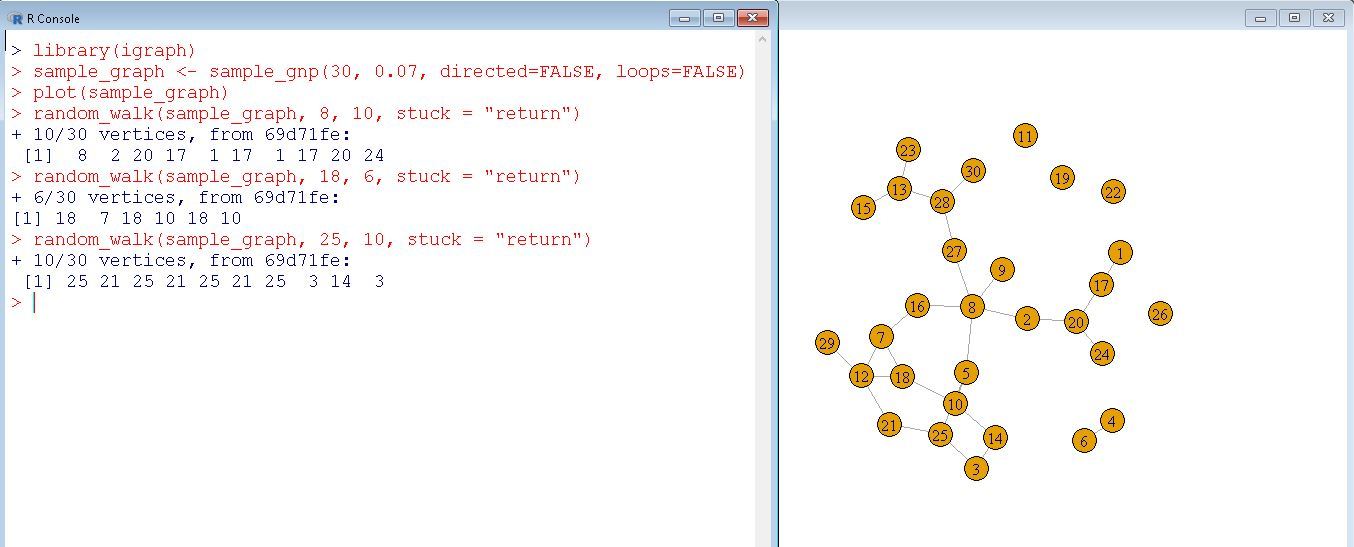
A Random Walk on a Graph
Now let us generate a random graph and walk through it using random_walk function.
Syntax:
random_walk(
  graph,
  start_node,
  Number_of_steps,
  stuck = "return"/"error"
)
This function allows us to do a random walk starting from start_node till Number_of_steps and in case if stuck or cannot move forward either returns or gives an error.
Example:
library(igraph)
sample_graph <- sample_gnp(30, 0.07, directed = FALSE, loops = FALSE)
plot(sample_graph)
random_walk(sample_graph, 8, 10, stuck = "return")
|
Output:
Visualizing a Network
Changing Edges and Vertices color
Now we will try to learn how to modify the colors of Vertices and Edges and make the graph more colorful.
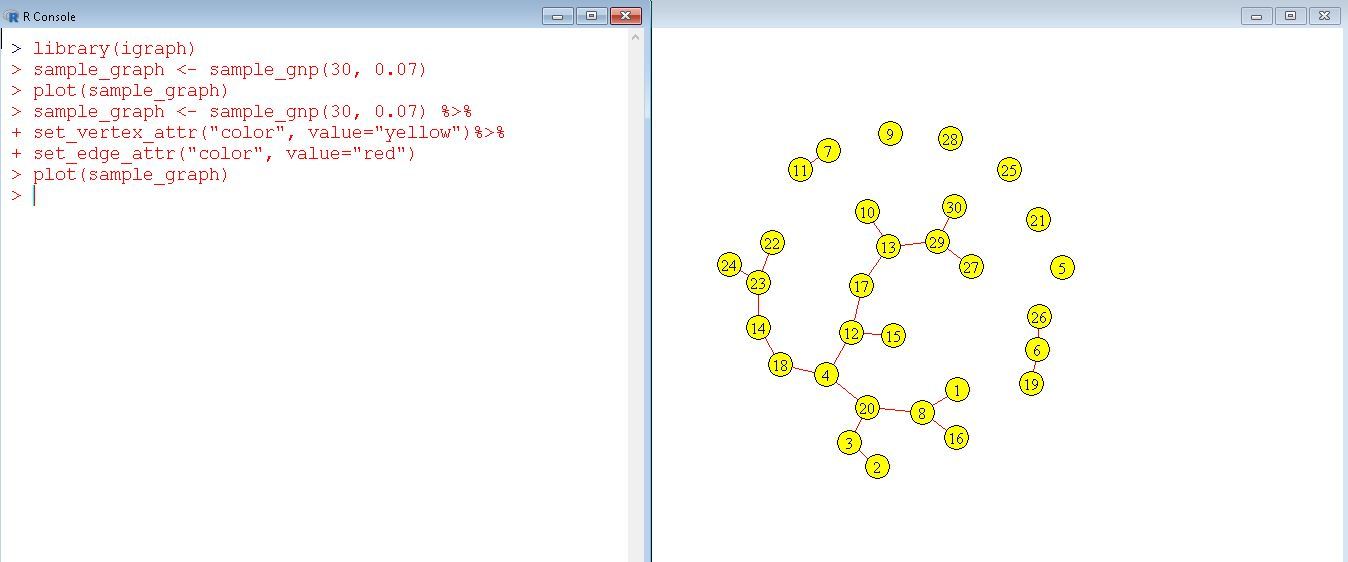
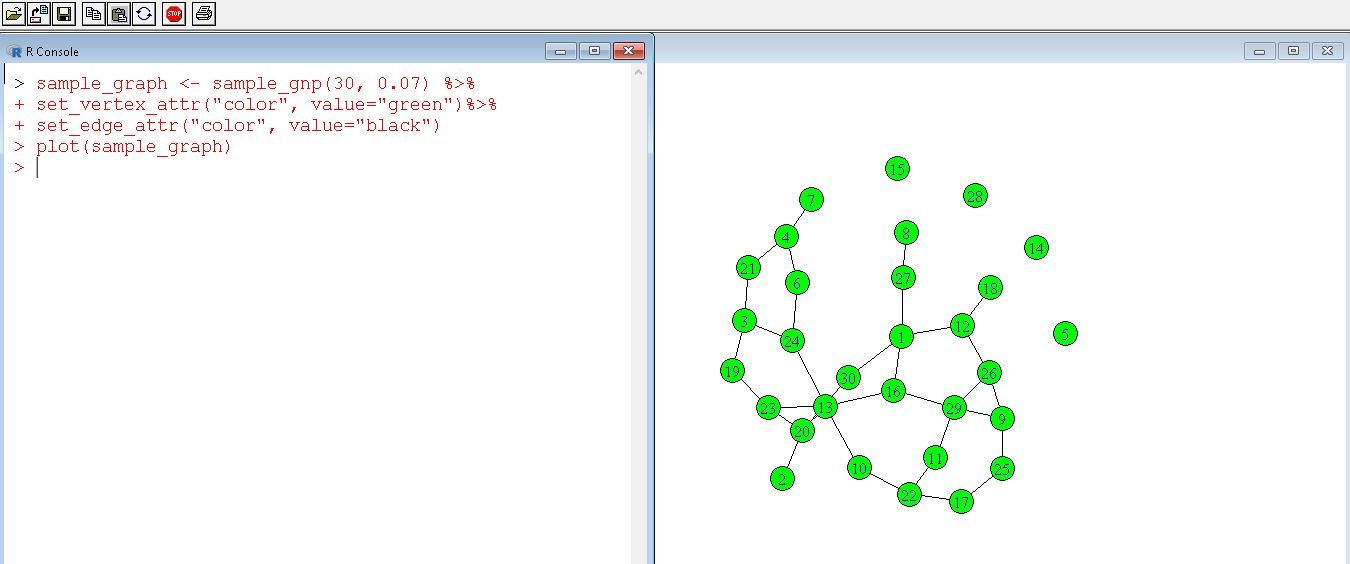
set_vertex_attr(graph, name_attr, value)
We will try to set a particular attribute value of vertices using this function.
set_edge_attr(graph, name, value)
This will be a similar function but the difference will be it sets edges attributes.
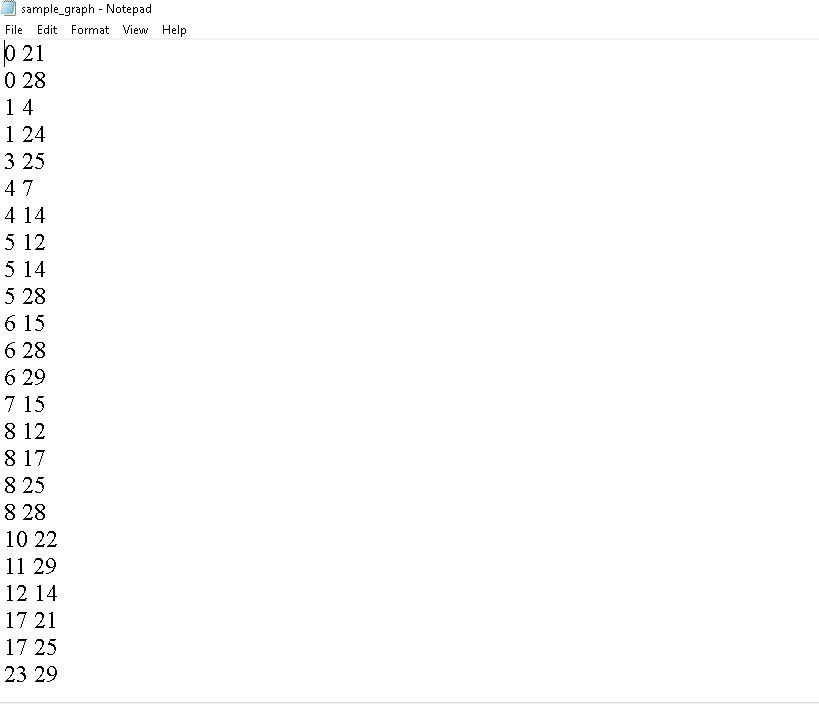
Writing out a graph
Using the below functions you can save the edge-list of the graph to your computer specifying the path.
write.graphs()
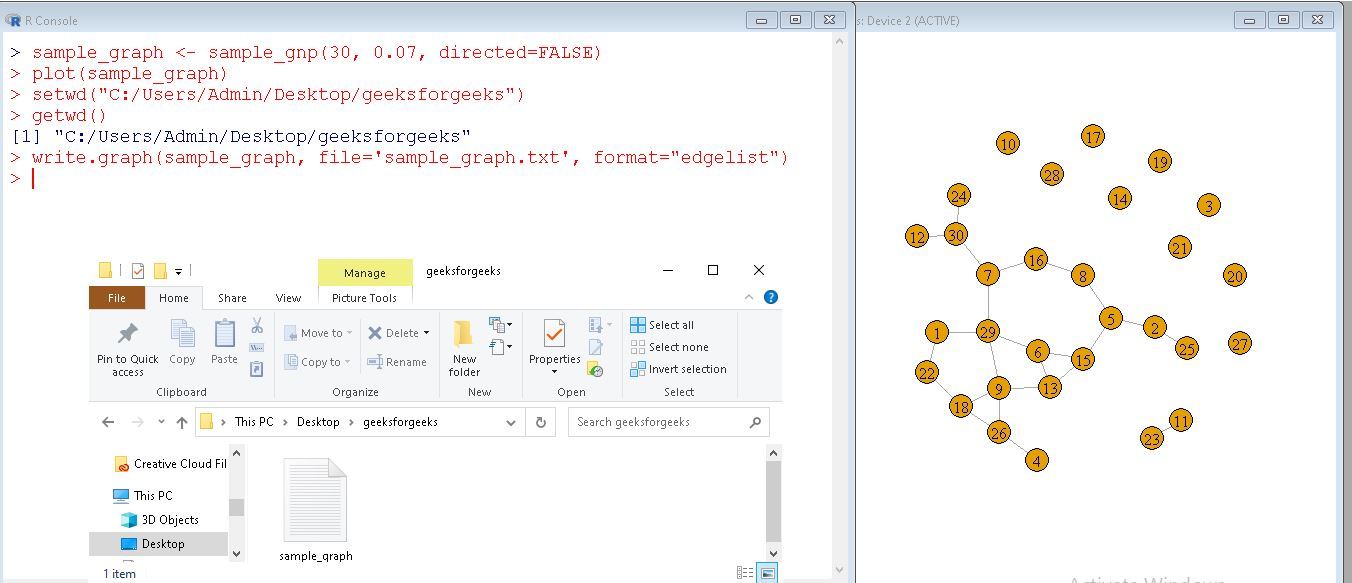
setwd(dir)
set working directory function allows you to set your desired directory for working with.
Note: While setting the path all the back-slashes should be changed to forward-slashes.
getwd()
This function returns the current dir path you are using.
write_graph(graph, format)
This function allows you to export graphs in a specific format such as edgelist/pajek/ncol/lgl/graphml/dimacs/gml etc.
Like Article
Suggest improvement
Share your thoughts in the comments
Please Login to comment...