K-Means Clustering in MATLAB
Last Updated :
16 Feb, 2023
K-means clustering is an unsupervised machine learning algorithm that is commonly used for clustering data points into groups or clusters. The algorithm tries to find K centroids in the data space that represent the center of each cluster. Each data point is then assigned to the nearest centroid, forming K clusters. The algorithm iteratively updates the centroids based on the mean of the data points assigned to it and re-assigns the data points to the closest centroid. This process is repeated until the centroids no longer move, or a maximum number of iterations is reached.
Here are two examples of k-means clustering with complete MATLAB code and explanations:
Example 1: Iris Dataset
The Iris dataset is a classic dataset used in machine learning and data mining. It contains measurements of the sepal length, sepal width, petal length, and petal width of three species of Iris flowers (Setosa, Versicolor, and Virginica). In this example, we will use k-means clustering to cluster the Iris dataset into three clusters based on the four features.
Matlab
load fisheriris;
X = [meas(:,1), meas(:,2), meas(:,3), meas(:,4)];
k = 3;
[idx, centroids] = kmeans(X, k);
figure;
gscatter(X(:,1), X(:,2), idx, 'bgr', '.', 10);
hold on;
plot(centroids(:,1), centroids(:,2), 'kx', 'MarkerSize', 15, 'LineWidth', 3);
legend('Cluster 1', 'Cluster 2', 'Cluster 3', 'Centroids');
title('K-Means Clustering Results');
xlabel('Sepal Length');
ylabel('Sepal Width');
|
Output:
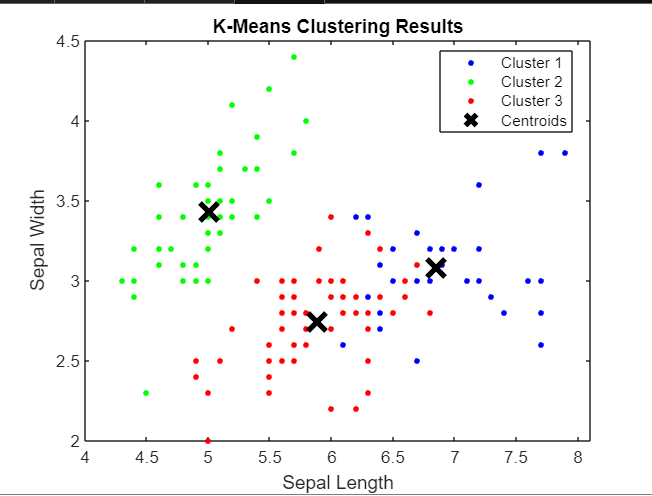
Iris Dataset using k means clustering
Explanation:
In this example, we first load the Iris dataset using the load() function. We then combine the four features into a matrix X. Next, we apply k-means clustering with k=3 using the kmeans() function. The kmeans() function returns the cluster indices idx and the centroid coordinates centroids. Finally, we plot the clustered data and the centroids using the gscatter() and plot() functions.
Example 2: Synthetic Data
In this example, we will generate a synthetic dataset of two clusters and use k-means clustering to cluster the data.
Matlab
rng(1);
X = [randn(100,2)*0.75+ones(100,2); randn(100,2)*0.5-ones(100,2)];
k = 2;
[idx, centroids] = kmeans(X, k);
figure;
gscatter(X(:,1), X(:,2), idx, 'bgr', '.', 10);
hold on;
plot(centroids(:,1), centroids(:,2), 'kx', 'MarkerSize', 15, 'LineWidth', 3);
legend('Cluster 1', 'Cluster 2', 'Centroids');
title('K-Means Clustering Results');
xlabel('X1');
ylabel('X2');
|
Output:
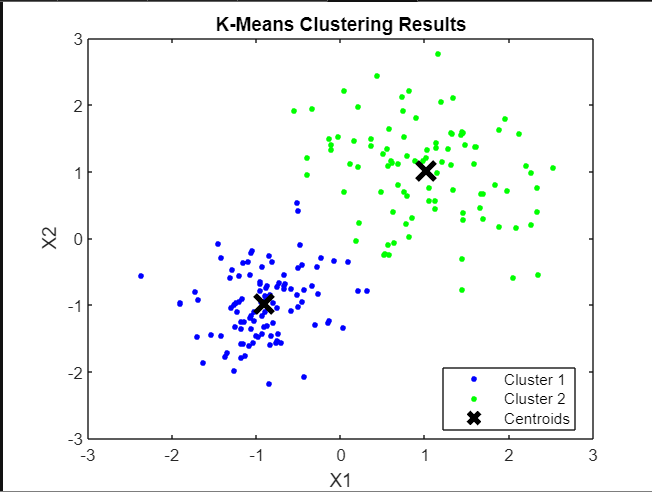
Synthetic Data using k means clustering
In this example, we first generate a random dataset of 200 points with two clusters using the randn() function. We then apply k-means clustering with k=2 using the kmeans() function. The kmeans() function returns the cluster indices idx and the centroid coordinates centroids. Finally, we plot the clustered data and the centroids using the gscatter() and plot() functions.
Applications of k-means clustering in MATLAB:
- Image segmentation.
- Market segmentation.
- Anomaly detection.
- Recommendation systems.
- Text clustering.
Share your thoughts in the comments
Please Login to comment...