CatBoost is a potent gradient-boosting technique developed for excellent performance and support for categorical features. Yandex created CatBoost, which is notable for its capacity to handle categorical data without requiring a lot of preprocessing. With little need for parameter adjustment, it provides excellent accuracy in predictive modelling jobs. It is appropriate for big datasets because of its effective implementation, which guarantees quick training. CatBoost is a well-liked option for machine learning professionals looking for a dependable and effective solution for regression and classification jobs because of its versatility, resistance to overfitting, and ease of use.
Catboost
For high-performance gradient boosting on structured datasets, CatBoost is a potent open-source machine-learning technique. CatBoost is very good at managing categorical features effectively and doesn’t require a lot of preprocessing. Through the optimization of categorical value ordering during training, it uses an approach known as ordered boosting to minimize overfitting. CatBoost also uses oblivious trees, which improve computational performance. Imputation is not necessary because the method handles missing values automatically. Adding decision trees to an ensemble iteratively during the training process helps CatBoost optimize the model’s performance. It has grown in popularity because of its innovative capabilities, easy-to-use interface, and steady handling of a wide range of datasets. As such, it is a useful tool for some machine learning tasks, such as regression analysis, ranking, and classification.
How Catboost Works
Catboost works on gradient boosting algorithms in which decision trees are constructed iteratively on each iteration and each tree improves the results of the previous trees leading to better results. The difference between catboost and other gradient boosting algorithms is that it handles the categorical features, performs cross-validation, regularization to avoid overfitting, etc, on its own which gives catboost an edge over other algorithms as no preprocessing is required.
How Catboost handles categorical features?
There are many traditional encoding methods supported by catboost but the one that is unique to it is Ordered encoding in which target encoding of some type is performed followed by random permutation of the dataset. Generally, this conversion consists of 3 steps –
- Random Permutation
- Quantization, which basically involves changing value to integers depending on the problem i.e. 0 and 1 for binary classification, 0 to n for multi-class classification, etc.
- Then, Encoding the categorical feature values.
Catboost Features
- Categorical Feature Handling: When handling categorical features, CatBoost performs exceptionally well and doesn’t require a lot of preprocessing. Categorical variables are internally encoded, which lowers the possibility of data leakage and enhances model performance.
- Handling of Missing Data: During training, CatBoost handles missing values automatically, removing the need for manual imputation. This streamlines the preprocessing procedures and enhances the model’s resilience.
- Efficient GPU Training: With GPU acceleration support, CatBoost enables faster training on suitable systems. Reducing training durations and managing big datasets are two advantages of this feature.
- User-friendly Interface: CatBoost provides a user-friendly interface, making it accessible to both beginners and experienced data scientists. It offers easy-to-use parameters and tools for model interpretation.
- Robustness: Regularization strategies are among the techniques that CatBoost uses to reduce overfitting and improve the model’s capacity to generalize to new, unobserved data.
Catboost Parameters
How much the model learns from the data depends on the parameters. These parameters can be adjusted accordingly by the programmer and each models has a unique set of parameters for a better performance. Catboost parameters are –
- iterations: Indicates how many trees or boosting rounds need to be constructed. The model performs better overall when there are more trees, but this can cause overfitting.
- learning_rate: It controls the optimization process’s step size. Requiring fewer rounds, lower values strengthen the optimization process.
- depth: sets the trees’ depth. Although they can cause overfitting, deeper trees can catch more intricate patterns. In order to balance for model complexity, this parameter is essential.
- l2_leaf_reg: It prevents the model from overfitting by penalizing large parameter values.
- random_strength: Regulates how randomly splits are chosen during training. Increasing the value can potentially prevent overfitting by adding additional unpredictability.
- cat_features: Indicates the categorical feature indices. Although CatBoost manages these aspects effectively on its own, performance can be enhanced by giving explicit indices.
- loss_function: It determines the loss function that will be used for calculating the loss. It depends on whether the problems is a regression or classification problem.
- early_stopping_rounds: If set, training ends after a predetermined number of rounds if the validation set’s evaluation metric doesn’t get better.
- num_folds: Defines how many folds will be used for cross-validation in training. aids in evaluating generalization and model performance.
Implementation of Catboost
It can be installed using the pip package of python. Here’s the command to install it:
!pip install catboost
Now, we’ll apply the catboost algorithm on a dataset to see how it’s better than other gradient boosting algorithms. For this, we’ll be using the iris dataset. You can download the dataset from the kaggle website – link
Importing necessary Libraries
Python
import pandas as pd
import numpy as np
from sklearn.model_selection import train_test_split
from catboost import CatBoostClassifier
from sklearn.model_selection import GridSearchCV
from sklearn.metrics import confusion_matrix, classification_report
import seaborn as sns
import matplotlib.pyplot as plt
|
Let’s import all the libraries we’ll be needing for this. The main libraries will be pandas, numpy, sklearn, and catboost.
Loading Dataset
Python
df = pd.read_csv('iris.csv')
print(df.head())
|
Output:
    sepal_length    sepal_width    petal_length    petal_width    species
0    5.1    3.5    1.4    0.2    setosa
1    4.9    3.0    1.4    0.2    setosa
2    4.7    3.2    1.3    0.2    setosa
3    4.6    3.1    1.5    0.2    setosa
4    5.0    3.6    1.4    0.2    setosa
Dataframe shape
Output:
(150, 5)
As shown in the output, the dataset has 5 columns and 150 rows. So basically, this dataset contains the sepal length, sepal width, petal length, petal width of three species of flower. We can see the uniques species using the below code.
Splitting data into features and target
Python
X = df.drop("Species", axis='columns')
Y = df['Species']
|
The dataset is divided into features (X) and the machine learning target variable (Y) in this code. Y is given the values from the “Species” column, and X is created by removing the “Species” column using the drop method. For the purpose of training and assessing machine learning models, where X stands for the input features and Y for the variable that needs to be predicted, this division is essential.
Splitting data into train and test sets
Python
X_train, X_test, Y_train, Y_test = train_test_split(
X, Y, test_size=0.2, random_state=5)
|
Upto now we have separated our feature and target values. Now we’ll split the data into train and test dataset using sklearn’s train_test_split method. This is important so that we can predict using unseen data and then calculate what is the performance of our model. We’ll keep the test_size 0.2 so that we can have 80 percent as train dataset and 20 percent as test.
Exploratory data analysis
Visualizing and comprehending the patterns, relationships, and distributions of the dataset are key components of exploratory data analysis, or EDA. In order to obtain understanding, spot patterns, and guide further data modeling and decision-making procedures, it makes use of statistical and graphical approaches.
Correlation Heatmap
Python3
correlation_matrix = df.corr()
plt.figure(figsize=(7, 4))
sns.heatmap(correlation_matrix, annot=True,
cmap='coolwarm', fmt=".2f", linewidths=0.5)
plt.title("Correlation Heatmap")
plt.show()
|
Output:
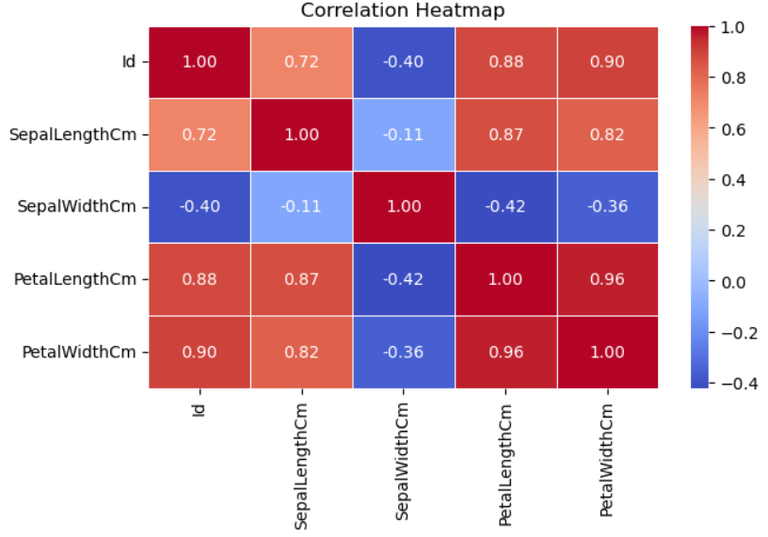
The pairwise correlation between the numerical features in the dataset is visualized using a correlation heatmap that is created by this code. The heatmap is produced using Seaborn’s heatmap function, and the correlation matrix is computed using the corr method. For improved viewing, the color map “coolwarm” is utilized in conjunction with the annot=True parameter to show the correlation coefficients on the heatmap.
Creating a catboost classifier
Python
model = CatBoostClassifier(iterations=500,
depth=6,
learning_rate=0.1,
loss_function='MultiClass',
verbose=200)
|
A CatBoostClassifier is initialized with particular hyperparameters by this code. A tree depth of 6 (depth), a learning rate of 0.1 (learning_rate), 500 boosting iterations (iterations), and the ‘MultiClass’ loss function appropriate for multiclass classification are all specified. Throughout the training procedure, the verbose=200 parameter publishes progress statistics every 200 iterations.
Grid Search for hyperparameter tuning
Let’s look into GridSeachCV now. We’ll start by importing the GridSearchCV method from sklearn.
Python
param_grid = {
'iterations': [500, 1000],
'depth': [4, 6, 8],
'learning_rate': [0.01, 0.1, 0.2],
'l2_leaf_reg': [1, 3, 5],
}
grid_search = GridSearchCV(estimator=model, param_grid=param_grid, cv=5, scoring='accuracy', n_jobs=-1)
grid_search.fit(X_train, Y_train)
best_params = grid_search.best_params_
print("Best Parameters:", best_params)
|
Ouput:
0:    learn: 1.0834641    total: 429us    remaining: 214ms
200:    learn: 0.1876038    total: 35.9ms    remaining: 53.4ms
400:    learn: 0.0771339    total: 70.9ms    remaining: 17.5ms
499:    learn: 0.0576554    total: 89.9ms    remaining: 0us
Best Parameters: {'depth': 4, 'iterations': 500, 'l2_leaf_reg': 1, 'learning_rate': 0.01}
This code uses the GridSearchCV function from scikit-learn to conduct a grid search for hyperparameter tuning. It investigates several hyperparameter combinations, including learning rate, L2 regularization strength, tree depth, and iteration count. The grid search is carried out using 5-fold cross-validation (cv=5), and accuracy (scoring=’accuracy’) is used to assess the model’s performance.
New model with best parameters
Python
model_2 = CatBoostClassifier(
**best_params, loss_function='MultiClass', verbose=200)
model_2.fit(X_train, Y_train)
|
Output:
0:    learn: 1.0826982    total: 454us    remaining: 227ms
200:    learn: 0.1530056    total: 87.4ms    remaining: 130ms
400:    learn: 0.0416217    total: 181ms    remaining: 44.7ms
499:    learn: 0.0256587    total: 222ms    remaining: 0us
This code uses the best hyperparameters found in the grid search (best_params) to build a new CatBoostClassifier (model_2). The training set of X_train and Y_train is used to train the model, with the loss_function explicitly specified to ‘MultiClass’. During training, progress updates will be reported every 200 iterations according to the verbose=200 parameter.
Prediction and Evaluation
Python
score = model_2.score(X_test, Y_test)
print("Model Accuracy:", score)
|
Output:
Model Accuracy: 1.0
Using the accuracy score, this function assesses how well the model_2 performs on the test data (X_test, Y_test). After that, the accuracy score that was produced is printed, giving an indication of how effectively the model generalizes to new data.
Confusion Matrix
Python3
y_pred = model_2.predict(X_test)
conf_matrix = confusion_matrix(Y_test, y_pred)
sns.heatmap(conf_matrix, annot=True, fmt='d', cmap='Pastel1',
xticklabels=model_2.classes_, yticklabels=model_2.classes_)
plt.title('Confusion Matrix')
plt.xlabel('Predicted Label')
plt.ylabel('True Label')
plt.show()
|
Output:
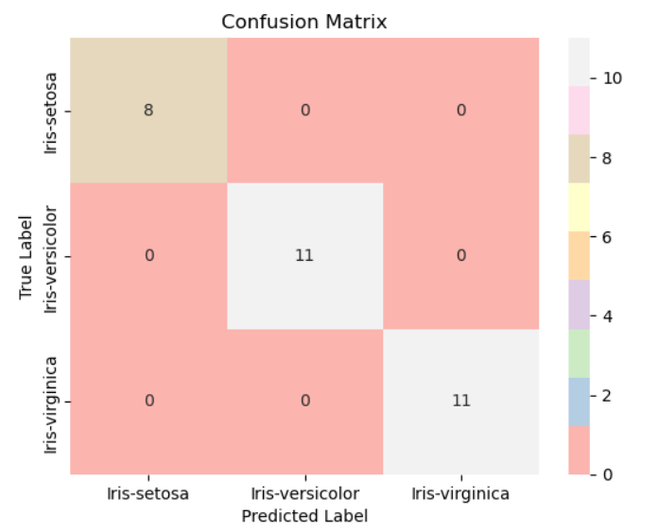
Based on the test data (X_test), his algorithm creates predictions (y_pred) using model 2. Next, by contrasting the true and predicted labels, it generates a confusion matrix (conf_matrix) to show how well the model is working. Analysis of the categorization results is aided by the heatmap with annotations that shows the confusion matrix.
Classification Report
Python3
class_report = classification_report(Y_test, y_pred)
print("Classification Report:\n", class_report)
|
Output:
Classification Report:
                  precision    recall  f1-score   support

    Iris-setosa       1.00      1.00      1.00         8
Iris-versicolor       1.00      1.00      1.00        11
 Iris-virginica       1.00      1.00      1.00        11

       accuracy                           1.00        30
      macro avg       1.00      1.00      1.00        30
   weighted avg       1.00      1.00      1.00        30
Using scikit-learn’s classification_report function, this code creates a classification report (class_report) that offers a thorough overview of classification metrics for each class, including precision, recall, F1-score, and support. After that, the report is printed for a thorough performance assessment.
Advantages and Disadvantages of catboost
Advantages:
- It can efficiently handle all the categorical variables without much preprocessing by using a bunch of encoding techniques.
- Implements certain techniques to avoid overfitting and making the model more robust.
- It comes with good default parameters which work quite well without much fine tuning.
Disadvantages:
- The model sizes are quite big which makes it difficult while deploying in a production environment.
- It is a memory intensive algorithm.
Conclusion
In this article, we learned a bit about catboost and how it is implemented using python and it’s libraries. Catboost is a vast library and there are so many things to tweak to get the best results. Considered as one of the best gradient boosting algorithms available out there, it can be used in solving many supervised learning tasks efficiently.
Share your thoughts in the comments
Please Login to comment...