CatBoost Monitoring training progress
Last Updated :
24 Oct, 2023
CatBoost is a powerful and efficient gradient-boosting library designed for training machine learning models for both classification and regression tasks. CatBoost became very popular in a short time for its robust handling of categorical features, automatic handling of missing values, and superior training speed. This library is particularly popular among data scientists and machine learning practitioners for its ability to deliver high-quality results with minimal memory consumption and hyperparameter tuning. Monitoring the training process in CatBoost is a crucial aspect of developing effective and optimized machine learning models. The training process involves iteratively updating the model’s parameters to minimize the chosen loss function, which can handle unseen data and make accurate predictions. In this article, we will see how we can monitor and visualize the training progress of the CatBoost model.
What is CatBoost?
CatBoost, or categorical boosting, is a machine learning algorithm developed by Yandex, a Russian multinational IT company. This special boosting algorithm is based on the gradient boosting framework and can handle categorical features more effectively than traditional gradient boosting algorithms by incorporating techniques like ordered boosting, oblivious trees, and advanced handling of categorical variables to achieve high performance with minimal hyperparameter tuning. CatBoost also has in-built parameters to monitor training progress, which helps to archive an efficient trained model for the particular task we are performing.
Why to monitor training progress
There are several benefits to monitoring training progress, which are discussed below.
- Performance Assessment: During training, it is important to track performance metrics like loss, accuracy or other custom evaluation metrics to know how our model is performing at each iteration. By monitoring these metrics, we can ensure that the model is learning and improving which allows us to catch any potential issues early in the training process.
- Overfitting Detection: Overfitting occurs when a model learns the training data too well and then fails to generalize to new and unseen data. Monitoring the training process helps us to identify overfitting by observing the divergence between training and validation performance. If we found the training loss continues to decrease while the validation loss starts to increase, it’s a sign of overfitting and we can observe it by monitoring training process only.
- Hyperparameter Tuning: Monitoring the training process helps us to gain insights into how different hyperparameters affect the model’s learning behavior which is a valuable information for making choices during hyperparameters tuning.
- Early Stopping: CatBoost allows us to use early stopping feature which can halt the training when the model’s performance on the validation set no longer improving with a certain number of specified iterations. Monitoring helps us to decide when to stop training which can prevent excessive non-valuable computations and reduces the risk of overfitting.
- Interpretability: Understanding how the model’s performance evolves during training can help us to gain insights into the data and the model’s behavior which is a valuable information for explaining model’s decisions to stakeholders or debugging issues.
Step-by-step implementation
Install CatBoost module
We need to install CatBoost module to our runtime before processed further.
!pip install catboost
Importing required libraries
Now we will install all required Python libraries like NumPy, Seaborn, Matplotlib, Pandas, Scikit Learn etc.
Python3
import numpy as np
import matplotlib.pyplot as plt
from catboost import CatBoostClassifier, Pool
from sklearn.datasets import load_wine
from sklearn.model_selection import train_test_split
from sklearn.metrics import accuracy_score, f1_score
import seaborn as sns
import pandas as pd
|
Dataset Loading and splitting
Now we will load the Wine dataset of Sklearn. Then we will split it into training and testing sets(80:20). After that, we will create CatBoost pools for both training and testing. This is required because CatBoost used to handle categorial features and optimizes memory usages by default. Now, to enable them we need to use CatBoost pools. Raw dataset can also be used to feed to the model but creating pools is a good practice.
Python3
data = load_wine()
X = data.data
y = data.target
X_train, X_test, y_train, y_test = train_test_split(X, y, test_size=0.2, random_state=42)
train_data = Pool(data=X_train, label=y_train)
test_data = Pool(data=X_test, label=y_test)
|
Exploratory Data Analysis
EDA helps us to gain deep insights about the dataset.
- Distribution of target classes: We will see the distribution of the classes of target feature. It will help to understand the class distribution which is essential for assessing class balance and potential data biases.
Python3
class_counts = np.bincount(y_train)
plt.figure(figsize=(5, 4))
sns.barplot(x=np.unique(y_train), y=class_counts)
plt.xlabel("Class")
plt.ylabel("Count")
plt.title("Distribution of Target Classes")
plt.show()
|
Output:
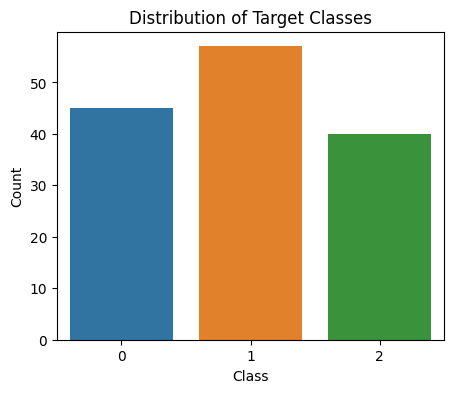
Distribution of target classes present in Wine dataset
- Correlation Matrix: Visualizing correlation matrix between features will help us to understand how they are related to each other and also helpful for feature selection or engineering(if any).
Python3
correlation_matrix = pd.DataFrame(X_train).corr()
plt.figure(figsize=(8, 4))
sns.heatmap(correlation_matrix, annot=True, cmap="coolwarm", fmt=".1f", linewidths=0.1)
plt.title("Feature Correlation Matrix")
plt.show()
|
Output:
.png)
Correlation matrix between features of Wine dataset
Model training
Now it is time to train our CatBoost model. We need to specify all required parameters for training and also for monitoring training progress. The parameters are listed below.
- iterations: This parameter sets the total number of boosting iterations which is the number of trees in the ensemble. Here we will set it to 500 which means the training process will create 500 decision trees (iterations).
- learning_rate: This parameter determines the step size for learning of the gradient boosting algorithm which scales the contribution of each tree to the final prediction. A smaller learning rate usually leads to a more robust model but requires more iterations.
- depth: This parameter controls the maximum depth of the decision trees. A deeper tree can capture more complex patterns but it may lead to overfitting problem.
- verbose: This parameter controls the level of logging and information displayed during training which is useful for monitoring the training process. Here we will set it to 100 which means that the training progress will be printed to the console every 100 iterations. This value can be changed to any desired values.
- early_stopping_rounds: This parameter enables early stopping during training. It specifies the total number of iterations at which training will be halted if no improvements in the validation metric. We have set it to 10 which means that if the validation metric does not improve for 10 consecutive iterations then the training will stop early.
- loss_function: This parameter specifies the loss function used to optimize the model during training. It is set to ‘MultiClass’ here as we are performing multiclass classification task.
Python3
model = CatBoostClassifier(iterations=500,
learning_rate=0.1,
depth=6,
verbose=100,
early_stopping_rounds=10,
loss_function='MultiClass')
model.fit(train_data, eval_set=test_data)
evals_result = model.get_evals_result()
train_loss = evals_result['learn']['MultiClass']
test_loss = evals_result['validation']['MultiClass']
|
Output:
 0:    learn: 1.0116527    test: 1.0140917    best: 1.0140917 (0)    total: 4.96ms    remaining: 2.48s
100:    learn: 0.0462522    test: 0.0755645    best: 0.0755645 (100)    total: 284ms    remaining: 1.12s
200:    learn: 0.0176734    test: 0.0405642    best: 0.0405642 (200)    total: 587ms    remaining: 873ms
300:    learn: 0.0106481    test: 0.0308054    best: 0.0308054 (300)    total: 882ms    remaining: 583ms
400:    learn: 0.0076143    test: 0.0258977    best: 0.0258977 (400)    total: 1.17s    remaining: 288ms
499:    learn: 0.0058919    test: 0.0223301    best: 0.0223301 (499)    total: 1.48s    remaining: 0us
bestTest = 0.02233007806
bestIteration = 499
Visualizing training progress
Now we will visualize the training progress of this model in graphical view.
Python3
iterations = np.arange(1, len(train_loss) + 1)
plt.figure(figsize=(7, 4))
plt.plot(iterations, train_loss, label='Training Loss', color='blue')
plt.plot(iterations, test_loss, label='Validation Loss', color='green')
plt.xlabel('Iteration')
plt.ylabel('Loss')
plt.title('CatBoost Training Progress')
plt.legend()
plt.grid()
plt.show()
|
Output:
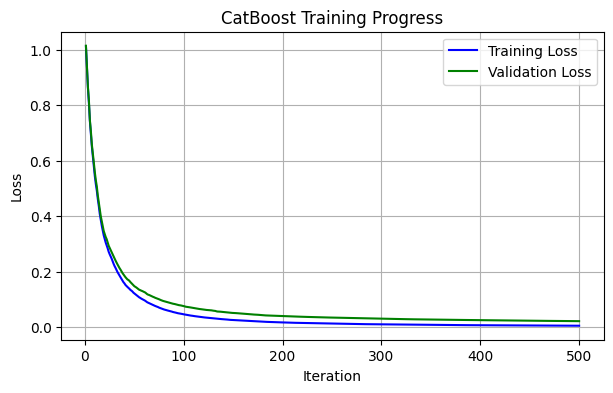
Training progress report for CatBoost model
Model evaluation
Finally, we will evaluate our model’s performance on model performance metrics like Accuracy and F1-score.
Python3
y_pred = model.predict(test_data)
accuracy = accuracy_score(y_test, y_pred)
f1 = f1_score(y_test, y_pred, average='weighted')
print(f"Accuracy: {accuracy}")
print(f"F1-Score: {f1}")
|
Output:
Accuracy: 1.0
F1-Score: 1.0
Conclusion
We can conclude that, monitoring training progress is very important to achieve an optimized and highly productive model which also protected from overfitting. Our model has achived both 100% accuracy and F1-score. But for real-world large datasets this value may be degraded highly. In that case, there only way to improve a model by performing hyperparameter tuning which requires an detailed monitoring of training process.
Share your thoughts in the comments
Please Login to comment...