How to visualize training progress in TensorFlow?
Last Updated :
27 Mar, 2024
Visualization training progress provides insights into how model is learning overtime, hence allowing practioners to monitor performance and gain insights from the training process. We can visualize the training progess using TensorBoard. TensorBoard is a web-based interface that monitors metrics like loss and accuracy, weights and bias and more. In this article, we are going to explore how we can visualize the training progress using TensorBoard.
Visualizing Training Progress in TensorFlow
The following code is used to visualize the training progress of a simple neural network model trained on the MNIST dataset. We will be following these steps to visualize the training progress in TensorFlow:
Step 1: Loading and Preprocessing Data
- Load the MNIST dataset using mnist.load_data().
- Normalize pixel values by dividing by 255 to scale them between 0 and 1.
import tensorflow as tf
from tensorflow.keras.datasets import mnist

# Load the MNIST dataset
(x_train, y_train), (x_test, y_test) = mnist.load_data()

# Preprocess the dataset
x_train, x_test = x_train / 255.0, x_test / 255.0
Step 2: Model Building
- Build a sequential model using tf.keras.Sequential().
- Add layers to the model using the model. add().
from tensorflow.keras.models import Sequential
from tensorflow.keras.layers import Flatten, Dense, Dropout

# Create a Sequential model
model = Sequential([
    Flatten(input_shape=(28, 28)),
    Dense(128, activation='relu'),
    Dropout(0.2),
    Dense(10)
])
Step 3: Compiling the Model
- Compile the model using the model.compile().
- Specify the optimizer, loss function, and metrics.
# Compile the model
model.compile(optimizer='adam',
              loss=tf.keras.losses.SparseCategoricalCrossentropy(from_logits=True),
              metrics=['accuracy'])
TensorBoard allows you to visualize various aspects of your model’s training, such as loss, accuracy, gradients, and more, in real-time. Here’s how you can use TensorBoard to visualize training progress in TensorFlow.
Step 4: Setting Up TensorBoard
To set up the TensorBoard, we need to import TensorBoard and other necessary libraries for using it in Python, you typically need to have TensorFlow installed.
from tensorflow.keras.callbacks import TensorBoard
import datetime
To use TensorBoard, you typically need a TensorBoard callback during the training process of your TensorFlow/Keras model. This callback will write logs to a specified directory that TensorBoard can then read and visualize.
# Set up TensorBoard callback
log_dir = "logs/fit/" + datetime.datetime.now().strftime("%Y%m%d-%H%M%S")
tensorboard_callback = TensorBoard(log_dir=log_dir, histogram_freq=1)
To specify TensorBoard callbacks in model training using TensorFlow/Keras.
# Train the model with TensorBoard callback
model.fit(x_train, y_train, epochs=5, validation_data=(x_test, y_test), callbacks=[tensorboard_callback])
Complete Code:
This code utilizes TensorFlow and Keras to train a neural network on the MNIST dataset. It employs a sequential model architecture with two dense layers. During training, it logs data to TensorBoard for visualization and monitoring. The trained model is saved to the specified log directory.
Python
import tensorflow as tf
from tensorflow import keras
import matplotlib.pyplot as plt
import numpy as np
from google.colab import drive
drive.mount('/content/drive')

(x_train, y_train), (x_test, y_test) = keras.datasets.mnist.load_data()

print(len(x_train))
print(len(x_test))
print(x_train.shape)

log_dir = '/content/drive/My Drive/logs/'
model = keras.Sequential([
    keras.layers.Flatten(input_shape=(28, 28)),
    keras.layers.Dense(100, activation='relu'),
    keras.layers.Dense(10, activation='sigmoid')
])

model.compile(optimizer='adam',
              loss='sparse_categorical_crossentropy',
              metrics=['accuracy'])

tb_callback = tf.keras.callbacks.TensorBoard(log_dir=log_dir, histogram_freq=1)

model.fit(x_train, y_train, epochs=5, callbacks=[tb_callback])
Start Tensor Board server
- Open a terminal and navigate to the directory containing your TensorFlow script.
- Run the following command to start the TensorBoard server:
%load_ext tensorboard
%tensorboard --logdir /content/drive/My\ Drive/logs/
- Access TensorBoard in your web browser by visiting the provided URL.
Visualizing the training progress in TensorBoard
Once TensorBoard is running, users can access the TensorBoard dashboard by navigating to the URL provided in their web browser. Within TensorBoard, a plethora of metrics can be visualized, including but not limited to loss, accuracy, learning rate, and histograms depicting the distribution of weights and biases across different layers of the model. The visualization experience is highly customizable, allowing users to tailor their analysis by selecting various tabs and options within the TensorBoard dashboard. Through these features, users gain valuable insights into the training progress of their TensorFlow models, facilitating informed decision-making and optimization strategies.
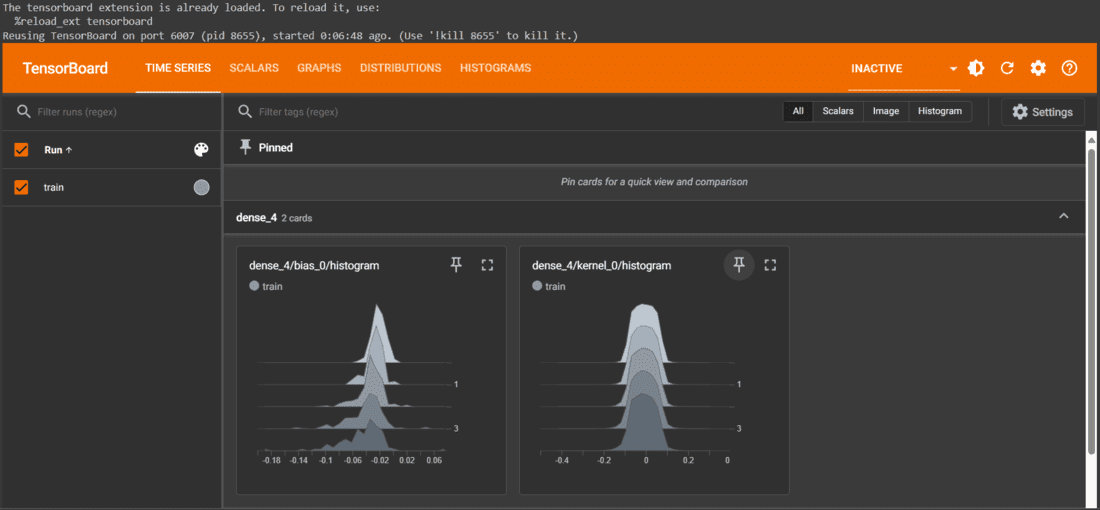
visualization by selecting different tabs and options
Why is visualizing training progress important in TensorFlow?
Here are some common reasons for this, as follows:.
- Monitoring Performance Metrics: During training, you can track performance metrics such as loss and accuracy to evaluate how well your model is performing on the training and validation datasets.
- Debugging and Diagnostics: Visualizing training progress allows you to diagnose issues that may arise during training, such as vanishing gradients, exploding gradients, or learning rate decay.
- Hyperparameter Tuning: Visualizing training progress helps you tune hyperparameters more effectively by observing how changes in hyperparameter learning rate and batch size affect model performance.
- Model Interpretability: Visualizations such as histograms of weights and biases, activation functions, and feature maps provide insights into how the model transforms input data and makes predictions.
- Comparing Models: Visualizing training progress allows you to compare multiple models or model variants to determine which one performs better.
Share your thoughts in the comments
Please Login to comment...