How To View Request Logs ?
Last Updated :
08 Apr, 2024
Stackdriver Logging is the default log service provided by the Google Cloud Platform. Logging in to the Google Cloud Platform (GCP) is like keeping a detailed journal of everything that happens and when it happens in your Google Cloud environment. It is important to be aware of what is going on with your apps and services since they provide you with security, problem-solving, event tracking, and performance monitoring. GCP provides a powerful logging service called Stackdriver Logging, which collects and stores logs from various sources like virtual machines, containers, databases, etc. By using logging, you can keep your apps operating smoothly, identify issues early, and obtain insights into your cloud operations.
Types Of Logs On GCP
- Request Logs: These logs capture information about incoming requests or traffic to your applications or services hosted on GCP. They include details like who made the request when it was made and what action was performed. Request logs play a crucial role in tracking activity, seeing trends, and troubleshooting problems.
- Application Logs: Messages that your apps create while they execute are stored in app logs. These logs capture events such as errors, warnings, and informational messages. They help developers understand how their code is performing and diagnose any issues that arise.
- System Logs: System logs shed light on the functionality and state of the GCP infrastructure constituent parts. They contain details on the system-level activities, including resource distribution, server restarts, and adjustments to network setup. System logs are crucial for keeping an eye on your cloud environment’s general health.
- Audit Logs: Audit logs keep track of and record GCP’s internal procedures and activities. They collect data on who took what action, when it was taken, and who took it. Audit logs serve as essential for tracking changes, verifying adherence, and investigating safety problems.
Steps To Create Cloud Run In GCP
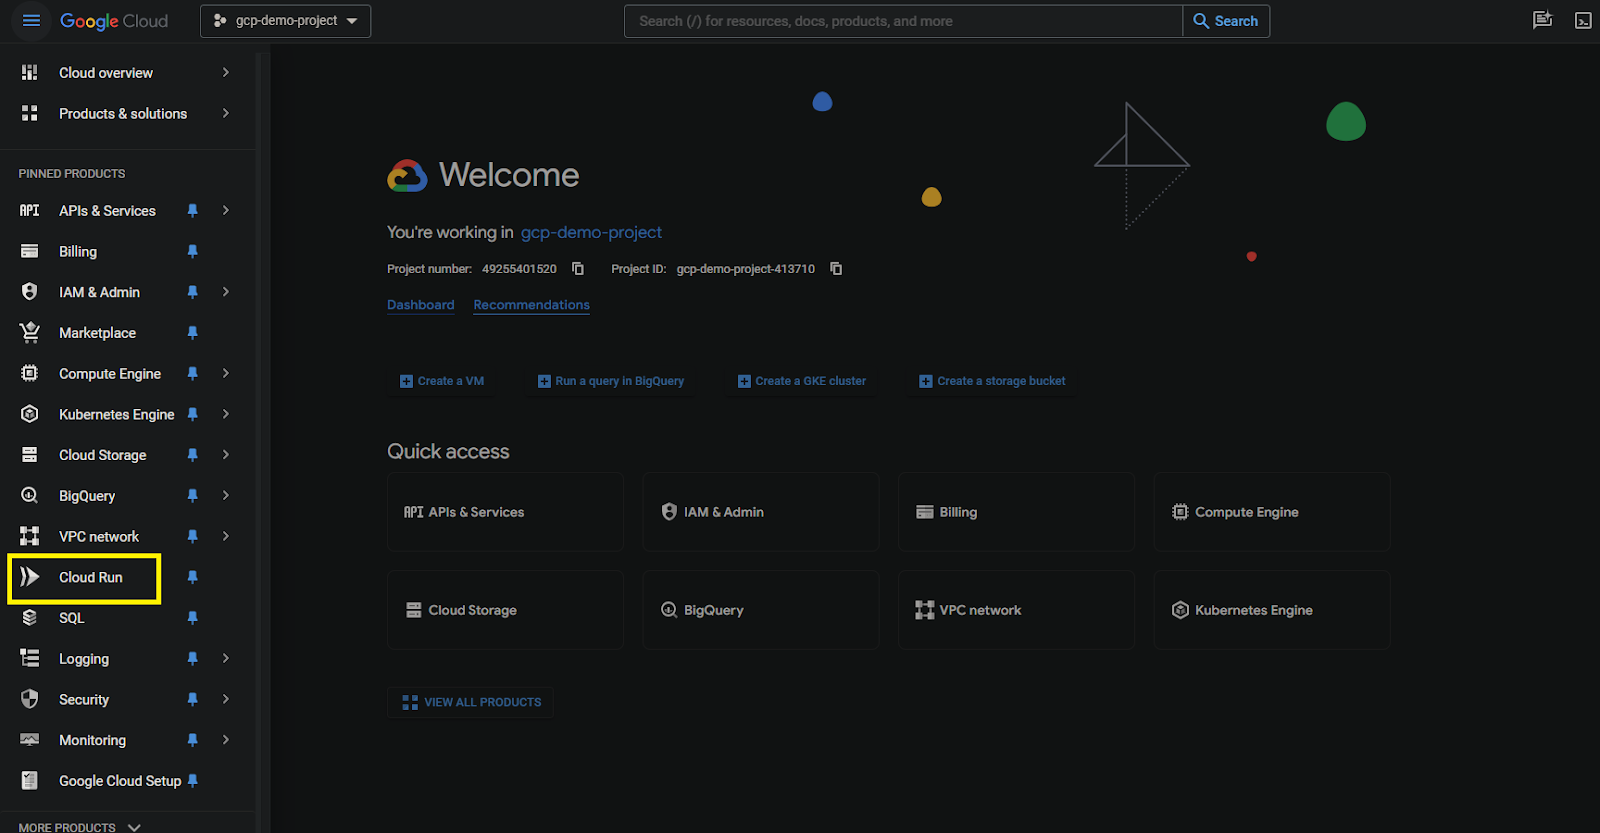
Step 1: Login into the GCP console and click on cloud run
Cloud Run is a serverless platform on Google Cloud that allows you to run containerized applications without worrying about infrastructure management. It pays you based on your actual usage and automatically scales your applications in response to traffic.
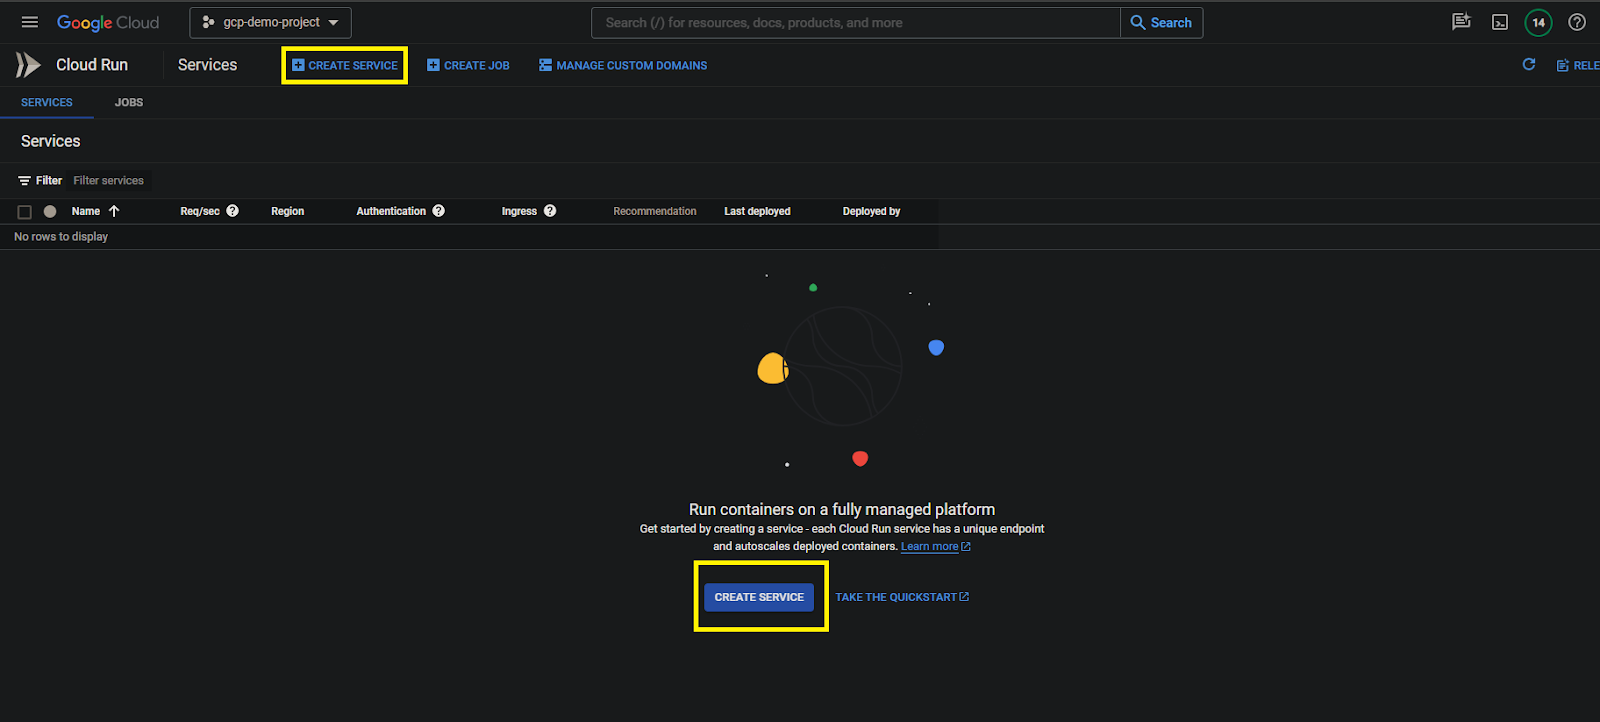
Step 2: Click on Create Instance.
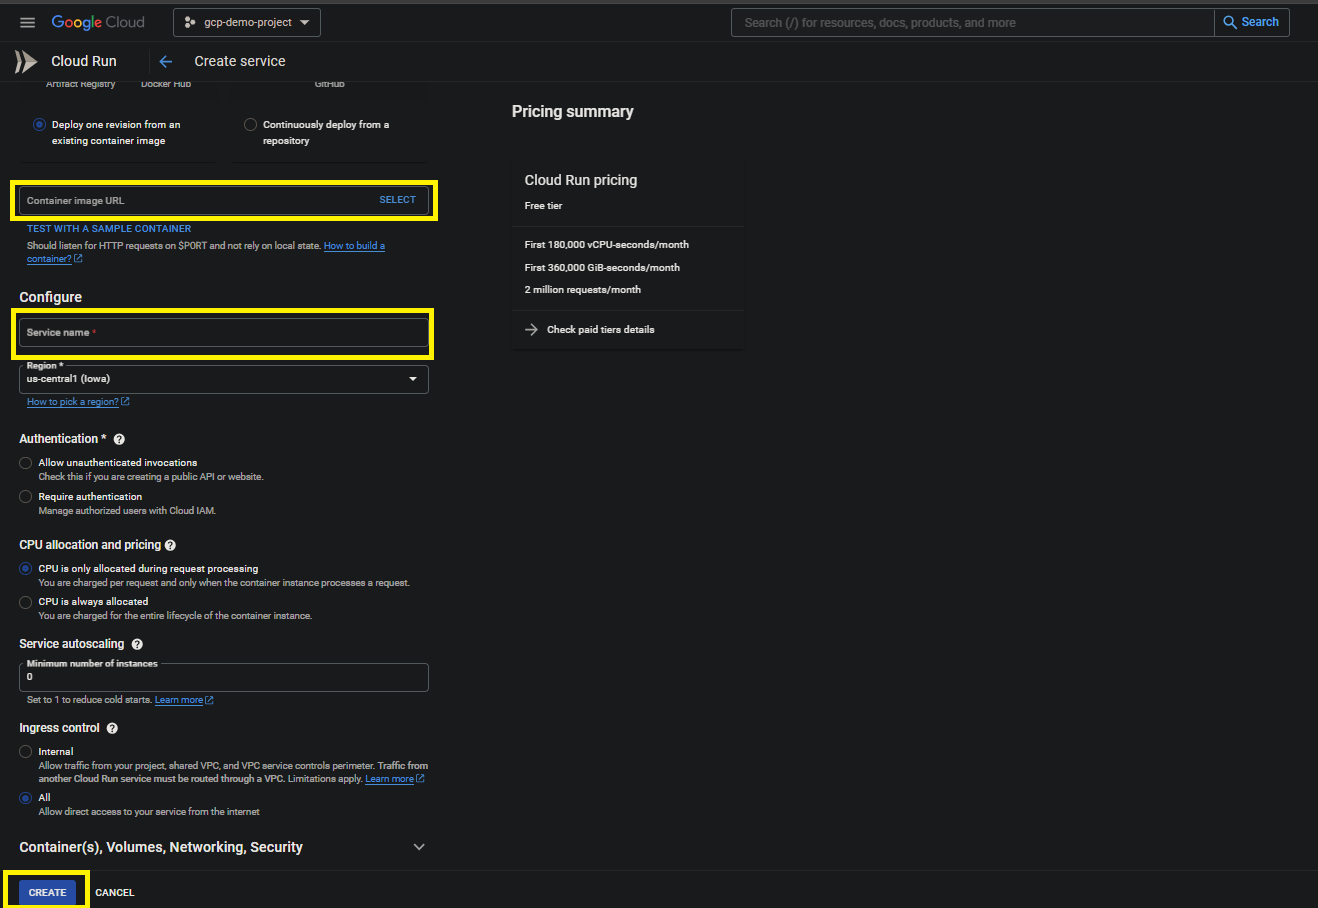
Step 3: Provide the required details like image, service name and click on container drop down and provide the necessary configuration.
Step 4: Deployed sample application on Cloud Run but not deployed properly due to port issue. Simmulated sample error we can verify the logs.
Steps To Verify The Logs In GCP
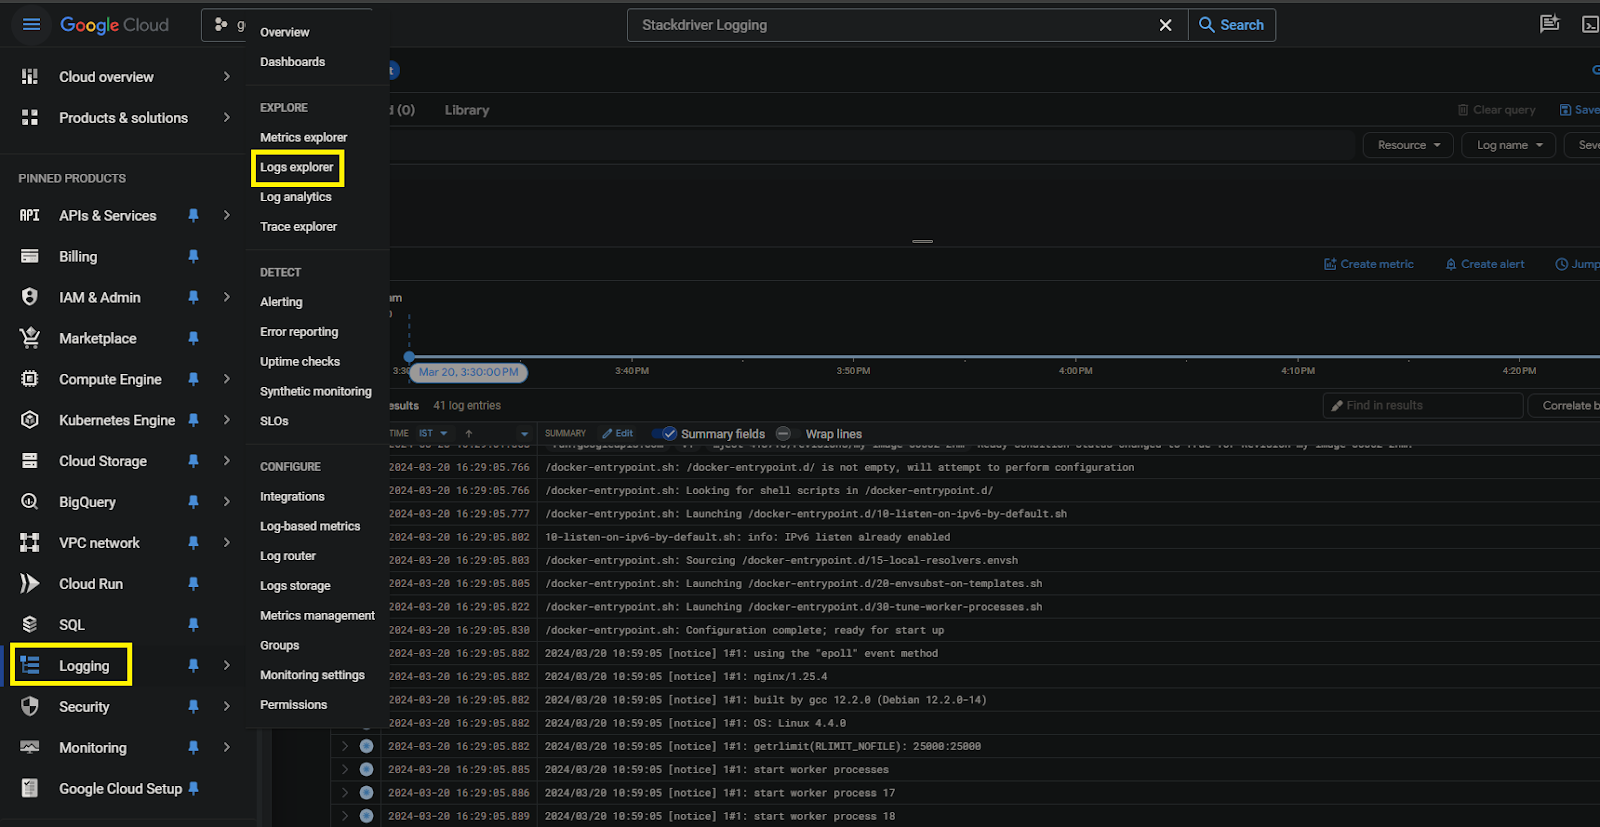
Step 1: Click on Logging in gcp and click on logexplorer.
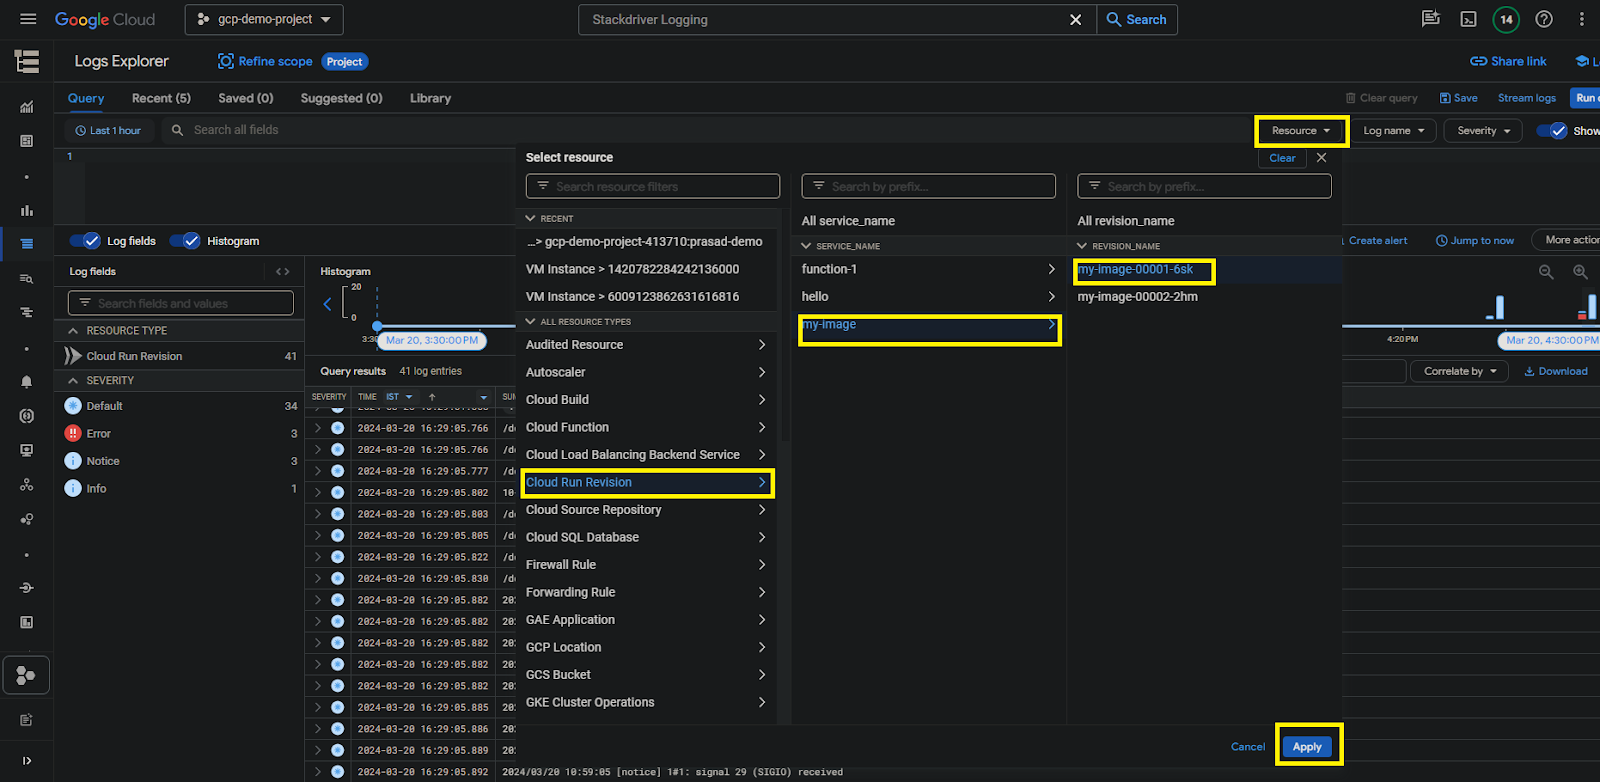
Step 2: Click on resource and selct the cloud run and select the srvice name and select the revision name. If you are not selecte by default it will select the latest revision. Afert that click on run query.
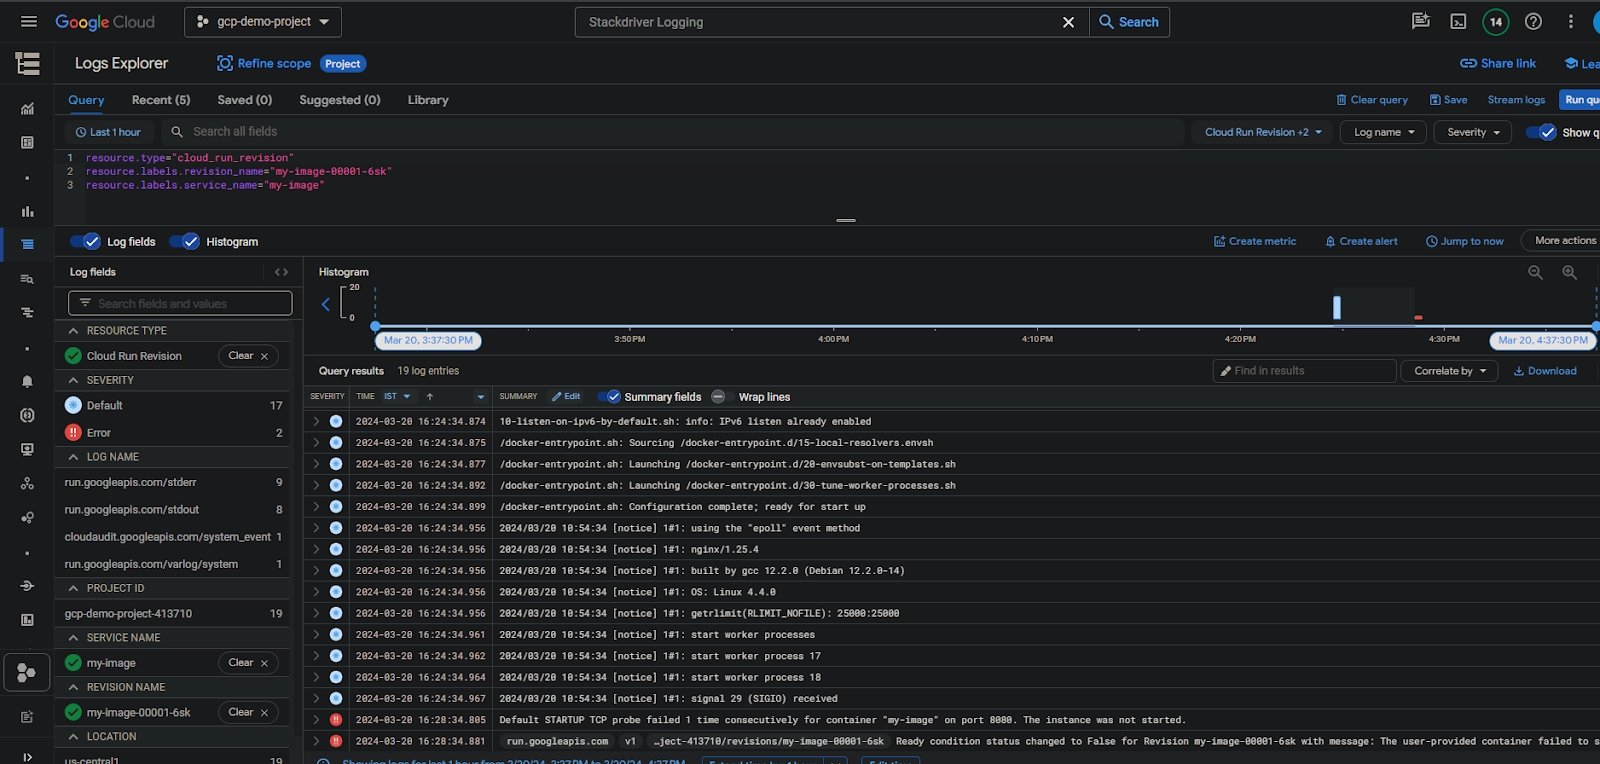
Step 3: Click on reunquery and the logs will be displayed and you can verify the logs and trobuleshoot the issue. I have selcted one hour time fram but you can select the time by clicking the clock symbol.
#Query
resource.type="cloud_run_revision"
resource.labels.revision_name="my-image-00001-6sk"
resource.labels.service_name="my-image"
You can see the logs it is the issue with port clearly displayed and now we can resolve and verify the logs in next step.
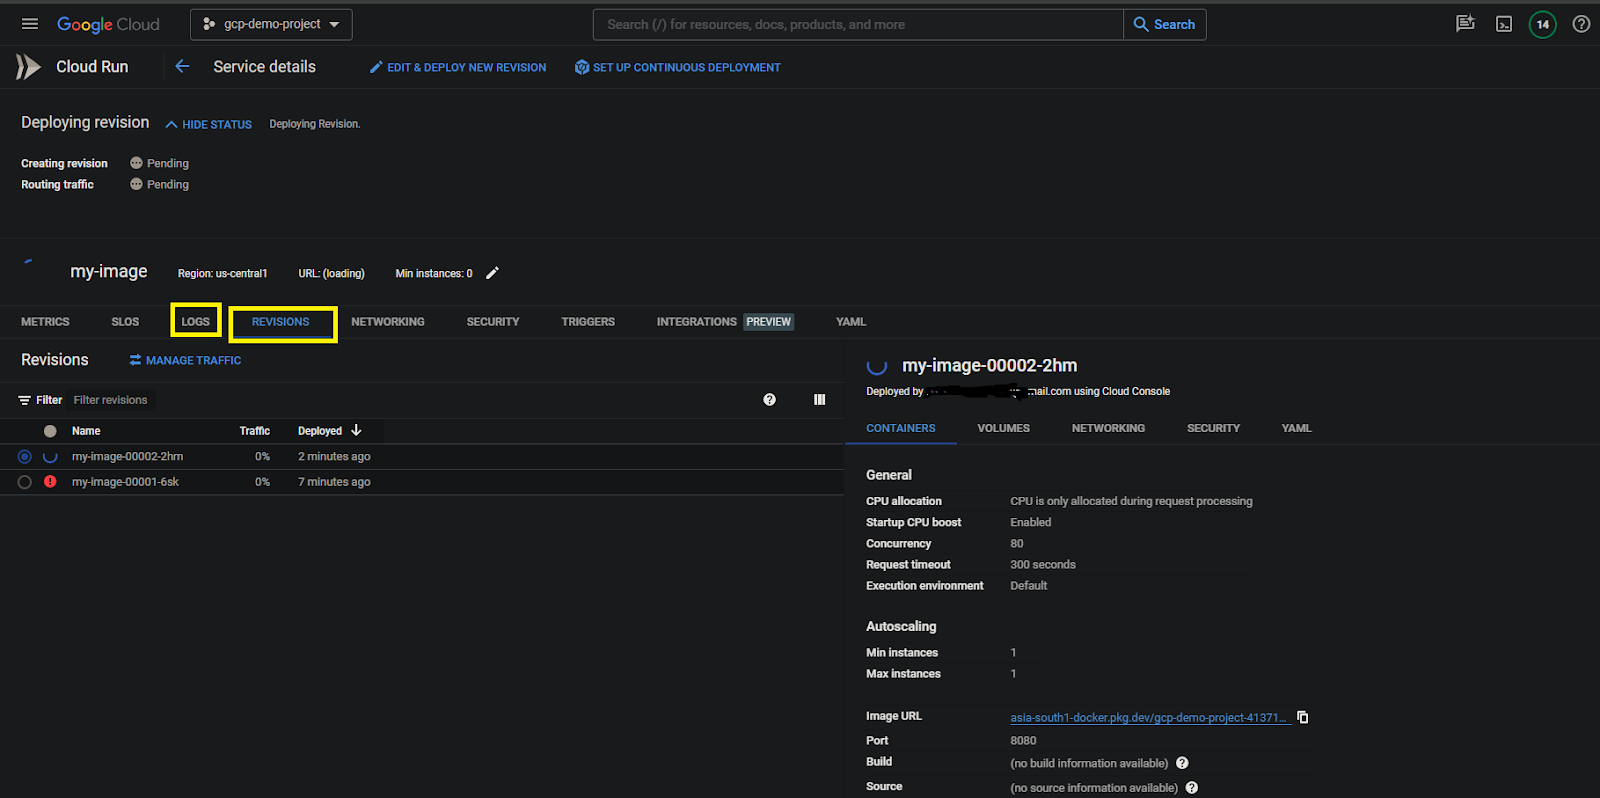
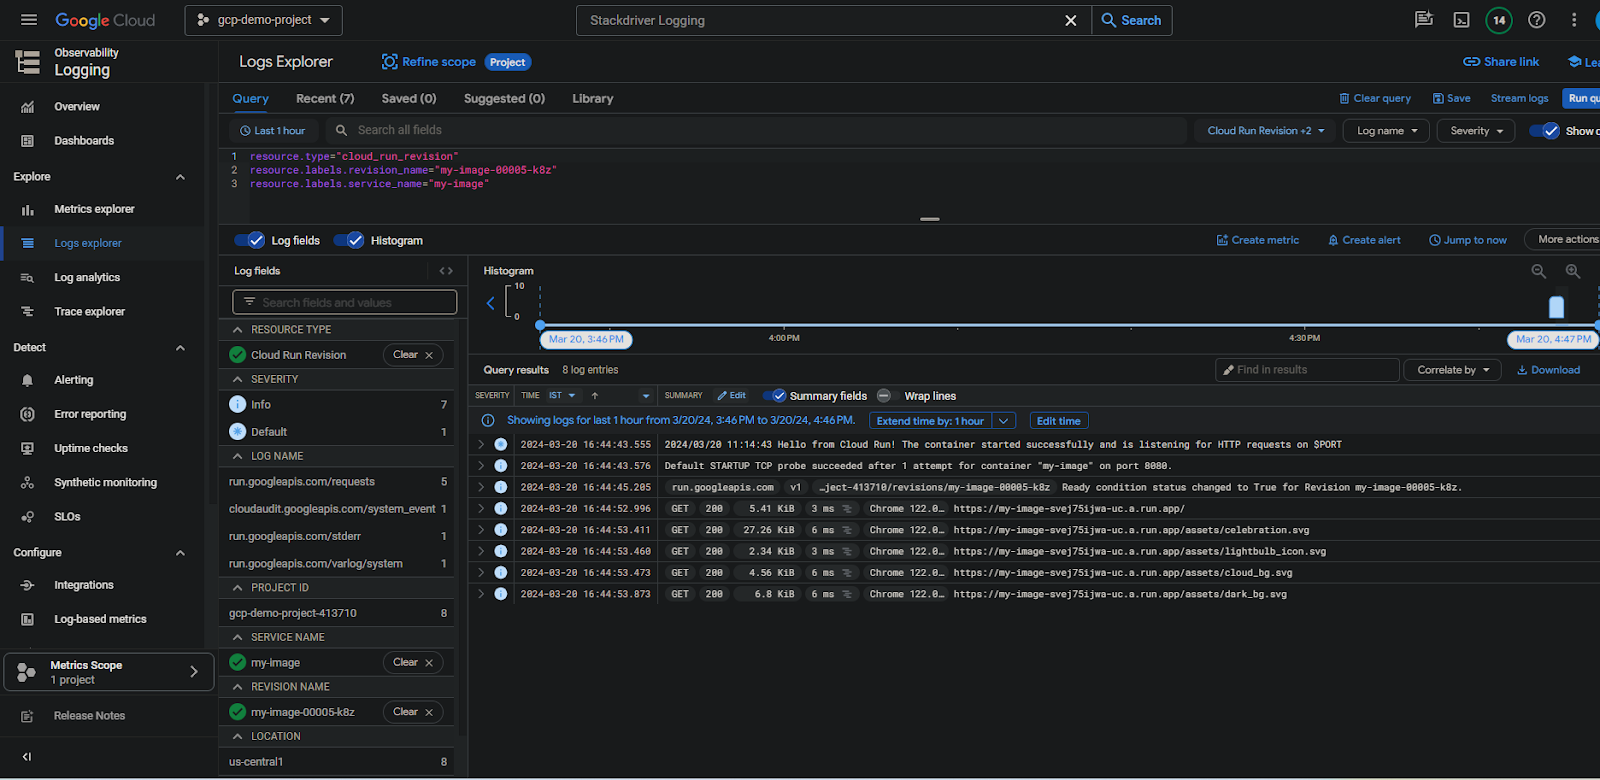
Step 4: Dployed another revision and now its deployed properly and you can observe the application logs and request logs on image.
resource.type="cloud_run_revision"
resource.labels.revision_name="my-image-00005-k8z"
resource.labels.service_name="my-image"
Log field: A particular piece of data or attribute included in a log entry is called a log field. It offers details about an individual facet of a transaction or event. Information like timestamps, request IDs, user agents, IP addresses, and more can be discovered in log fields.
Histogram: A histogram is a statistical depiction that shows the frequency or distribution of values within each bin by classifying data into intervals or bins. A histogram can be used in the logging context to show the distribution of specific log field values across time or across other dimensions. This facilitates finding trends, abnormalities, or patterns in the log data.
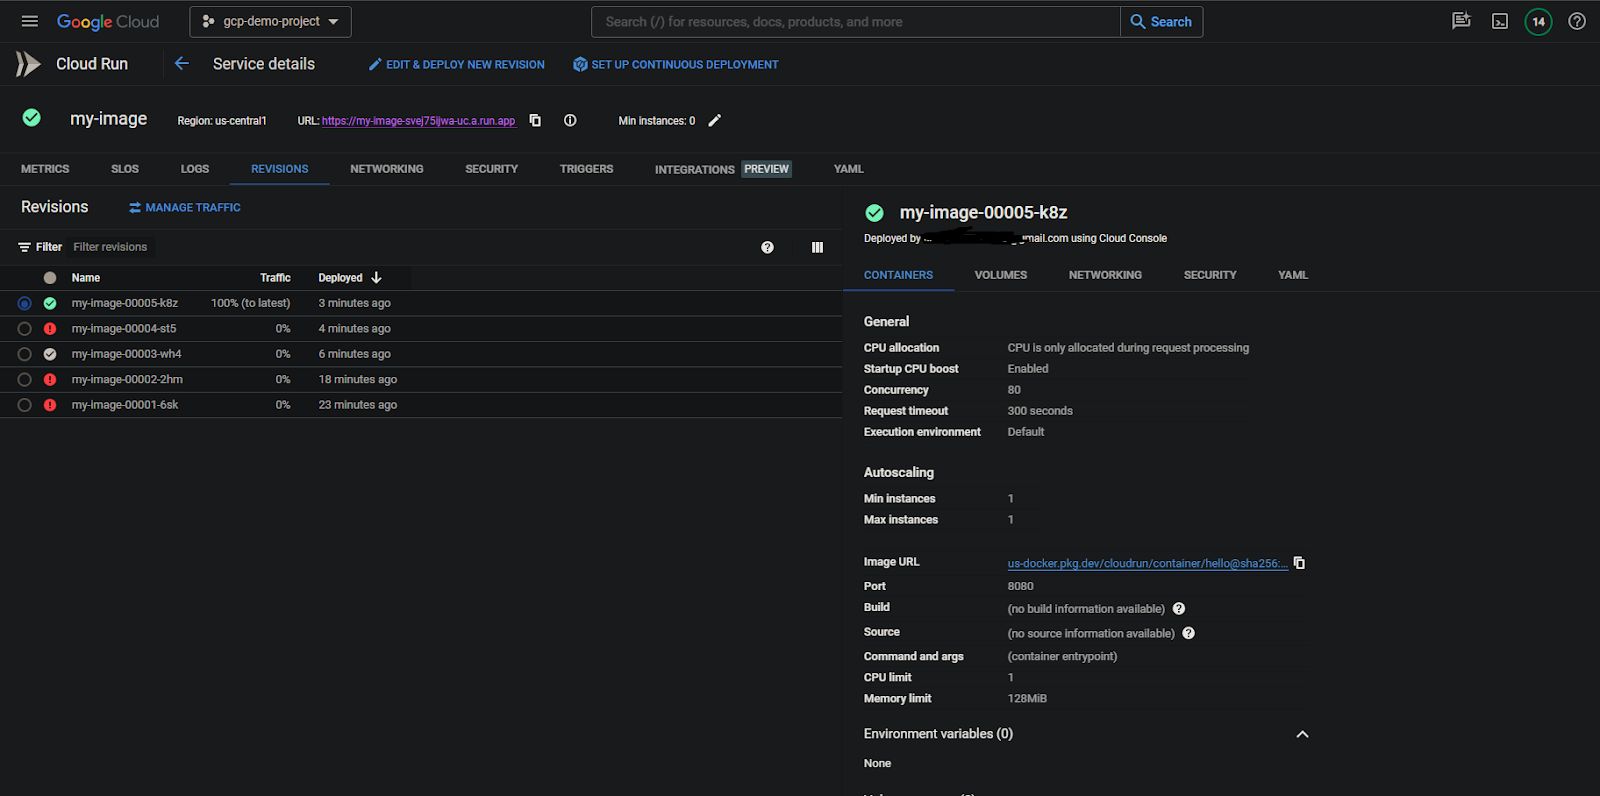
Step 5: Here ar the revisions i have dployed for simmulating the logs on cloud run and you want the system metrics like (cpu, memory, requestcout, trraffic) you can click on metrics tab and it will dispaly in dashboards.
Google Cloud Platform View Request Logs – FAQ’s
How do I access Google Cloud logs?
You can access Google Cloud logs through the Google Cloud Console or by using the Cloud Logging API. In the Cloud Console, navigate to the Logging section to view and search logs, while the API allows programmatic access for querying and analyzing logs.
How do I check my GCP activity log?
To check your GCP activity log, navigate to the “Logging” section in the Google Cloud Console. There, you can access and filter activity logs to view details of actions performed within your GCP projects.
Share your thoughts in the comments
Please Login to comment...