How to use R with Google Colaboratory?
Last Updated :
27 Sep, 2023
Google Colaboratory or in short Google Colab is a powerful cloud platform providing free access to limited resources like GPU or TPU. These resources can be used in Deep Learning. It is similar to the Jupyter Notebook in appearance as well as in features. It comprises cells where one can write Python codes and execute them. It also provides the facility of sharing in real time. There are other features of Google Colab. Some of them are:
- It allows users to share notebooks in real time.
- It helps to import external datasets.
- It helps to upload notebooks.
- Most of the libraries are available in Google Colab. Hence very few libraries are required to be installed.
About R
R is a powerful programming language used for data analysis and statistical analysis. As we all know Data visualization is a very crucial step in the field of Data Science. Hence R proves to be useful as it provides a vast amount of libraries and tools that are required for data analysis and visualization. Some of the features of R includes:
- It is open source.
- It provides a vast amount of tools for statistical calculations.
- It can be installed free of cost.
- It can be used on other platforms.
- R can be integrated with other programming languages like Python.
We can install the R programming language using the link ‘How to install R‘. However, Google Colab can be used for R programming as well.
Ways to use R with Google Colaboratory
There are two ways to use R with Google Colab. Let us have a look at each of them.
First Way
The first way is very simple. The steps are as follows:
1) Open the Google Colaboratory and then click on the new notebook.

Opening Google Colab
2) When the new Notebook opens, click on the Runtime option that is available from the list of options.

Clicking on Runtime
3) Then a dropdown appears. From the dropdown click on Change Runtime Type.

Click on Runtime type
4) A dialog box appears. Under the heading Runtime type by default Python3 appears. Click on the arrow and change it to R. After that click on Save.
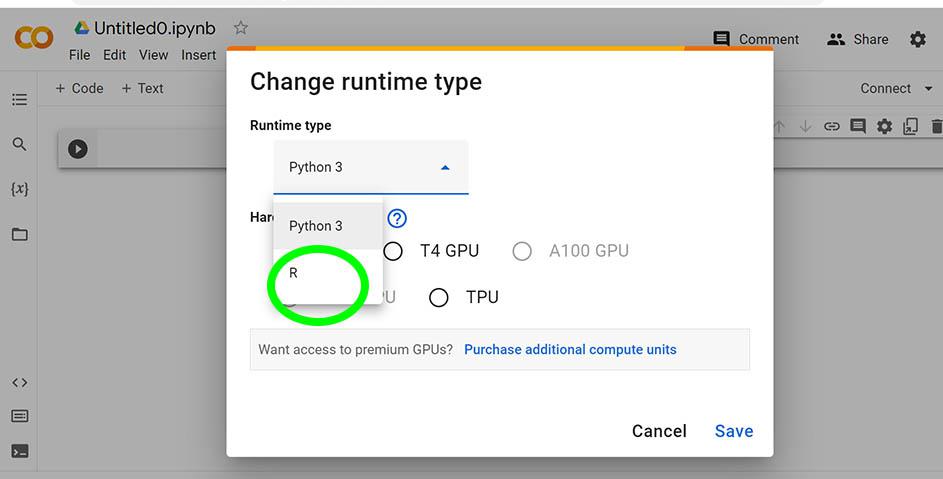
Choose R
5) Execute any command of R. You will get to see the results.

Executing R commands
In the above output we have created two vectors named vector 1 and vector 2. Then we passed vector1 and vector2 as parameters in the plot function to create a plot where vector 1 comprises of x coordinates and vector 2 comprises y coordinates.
Second Way
The second way is useful when you want to use both Python and R. The steps are as follows:
1) Open the Google Colaboratory and then click on the new notebook.
2) In the cell execute the magic command %load_ext rpy2.ipython .
3) Now whenever you need to use R commands in each cell write %%R at the beginning followed by R commands.
4) After that execute the cell using Ctrl+Enter.

Executing R
In the above output we can see a plot that has been created using plot function. We have created two vectors named vector 1 and vector 2. Then we passed vector1 and vector2 as parameters in the plot function to create a plot where vector 1 comprises of x coordinates and vector 2 comprises y coordinates.Using these two techniques as mentioned one can use R on this cloud platform without installing R package.
How to Save and open R file in Google Colab?
Google Colab automatically saves our work. However due to some network issues the work might not get saved properly. If the work is not saved then Colaboratory issues a warning that the work has not been saved yet. Press Ctrl+S to save your work. For downloading the file follow the steps:
1) Click on file.
2) Click on download and then click on Download ipynb.
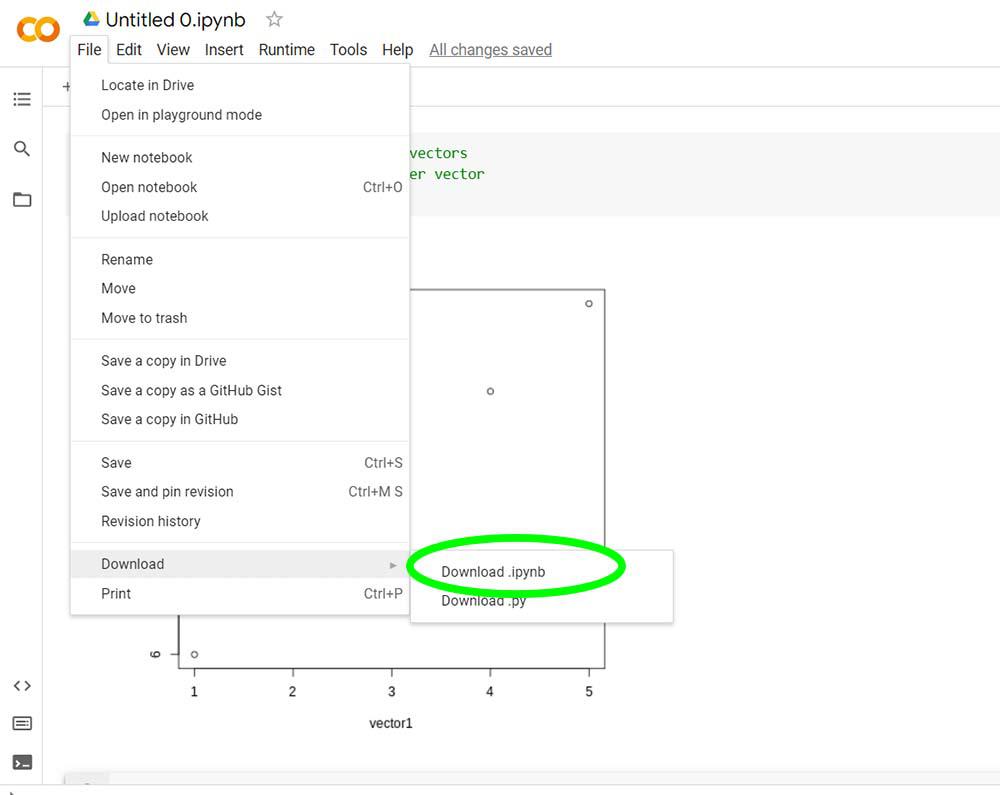
Download ipynb file
Now whenever you want to upload notebook click on Upload notebook. Then click on the ipynb file that you want to upload. After that change the runtime if required (that is first approach is used) and then execute the cells one by one.
To open a notebook follow these steps
1) Click on file option and then click on Open notebook option.

Click on open
2) A dialog box appears. Click on the file that you want to open. The file will be opened in a new tab.
Let us create a scatter plot using ggplot library of R that establishes a relation between unemployment rate and month. First change the runtime type to R. Then install ggplot using the command :
R
library(ggplot2)
rate<-c(6.9, 6.7, 6.6, 6.5, 7.3, 6.2, 7.0, 6.9, 6.7, 6.6, 6.5, 6.4)
month <- c("Jan", "Feb", "Mar", "Apr", "May", "Jun", "Jul", "Aug",
"Sept", "Oct", "Nov", "Dec")
monthly_rate<-data.frame(Month=month,Unemployment=rate)
print(monthly_rate)
unemp_March<-monthly_rate$Unemployment[monthly_rate$Month=="Apr"]
print(unemp_March)
name<-monthly_rate$Month[monthly_rate$Unemployment<6.5]
print(name)
ggplot(monthly_rate, aes(x = Month, y = Unemployment)) +
geom_point() +
labs(x = "Month", y = "Rate") +
ggtitle("Rate vs. Month")
|
Output:
Month Unemployment
1    Jan          6.9
2    Feb          6.7
3    Mar          6.6
4    Apr          6.5
5    May          7.3
6    Jun          6.2
7    Jul          7.0
8    Aug          6.9
9   Sept          6.7
10   Oct          6.6
11   Nov          6.5
12   Dec          6.4
[1] 6.5
[1] "Jun" "Dec"

We create two vectors – one is moth and other is unemployment rate. Then a dataframe is created that comprises these two vectors. We use conditions to extract values of a specific month. To access the columns use ‘$’ to extract them. Finally we use ggplot and geompoint to create a scatter plot. Pass the columns as parameters to ggplot function and set the title. Display the results.
Share your thoughts in the comments
Please Login to comment...