Google Cloud Monitoring & Google Cloud Logging
Last Updated :
02 Jan, 2024
In cloud computing, handling and tracking the performance of your infrastructure is important for ensuring optimal functionality, identifying troubles, and retaining the overall health of your packages. Google Cloud Platform (GCP) provides robust tools for tracking and logging, offering customers precious insights into their systems. In this text, we will discover two critical additives of GCP’s monitoring and logging surroundings: Google Cloud Monitoring and Google Cloud Logging.
What is Google Cloud Monitoring
It is an effective solution designed to help users benefit from visibility into the overall performance and health of applications, services, and infrastructure on GCP. It offers actual-time monitoring, alerting, and diagnostics, permitting corporations to proactively deal with troubles and optimize their structures.
Key Features
- Monitoring Dashboards: Google Cloud Monitoring enables users to create custom dashboards that consolidate applicable metrics and visualizations. These dashboards offer a centralized view of your resources, bearing in mind clean monitoring of key performance indicators.
- Metrics Explorer: With Metrics Explorer, customers can discover and analyze a sizable array of metrics from their GCP resources. This device supports filtering and grouping to tailor metrics exploration based totally on specific standards, making it easier to pinpoint and troubleshoot overall performance bottlenecks.
- Alerting Policies: Setting up alerting rules is crucial for proactive difficulty detection. Google Cloud Monitoring lets in users to define custom alerting regulations based on certain conditions, consisting of threshold values or patterns in metric records. When an alert is brought about, notifications can be despatched through various channels, which include e mail, SMS, or integration with third-party offerings.
- Integration with Stackdriver: Google Cloud Monitoring is included with Stackdriver, Google’s comprehensive monitoring and logging suite. This integration enhances the tracking abilities, imparting a unified platform for coping with and reading overall performance information.
Google Cloud Monitoring (Step-by-Step Guide)
Step 1: Enable Monitoring API
Open the Google Cloud Console.
Select your existing project or create a new project.
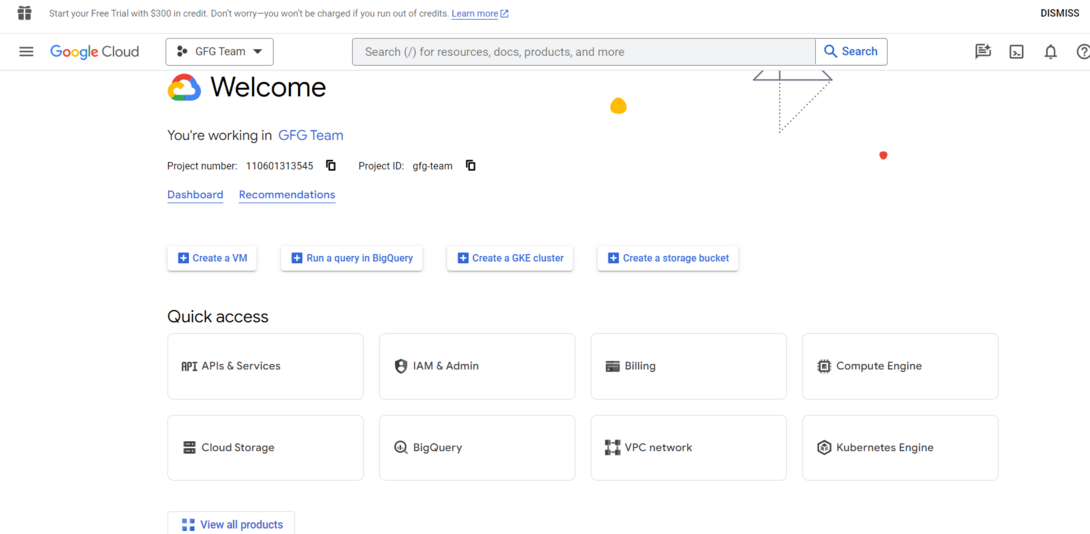
Navigate to the “APIs & Services” > “Dashboard” and click on on the “+ ENABLE APIS AND SERVICES” button.
Search for “Monitoring API” and enable it.
Step 2: Create a Monitoring Workspace
In the Google Cloud Console, navigate to “Monitoring” > “Dashboards.”
Click on “Create Dashboard.“
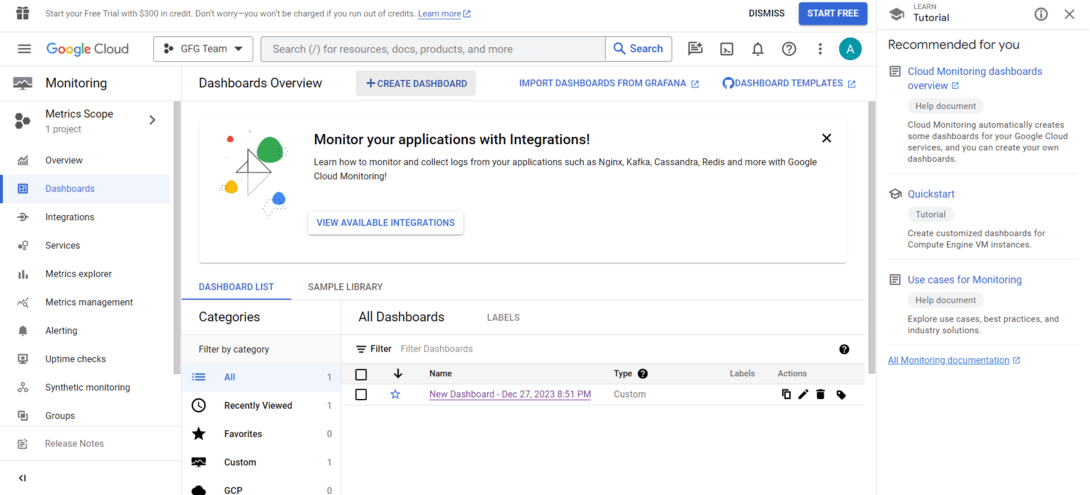
Click on Create Dashboard
Add charts and widgets in your dashboard based totally to your monitoring requirements.
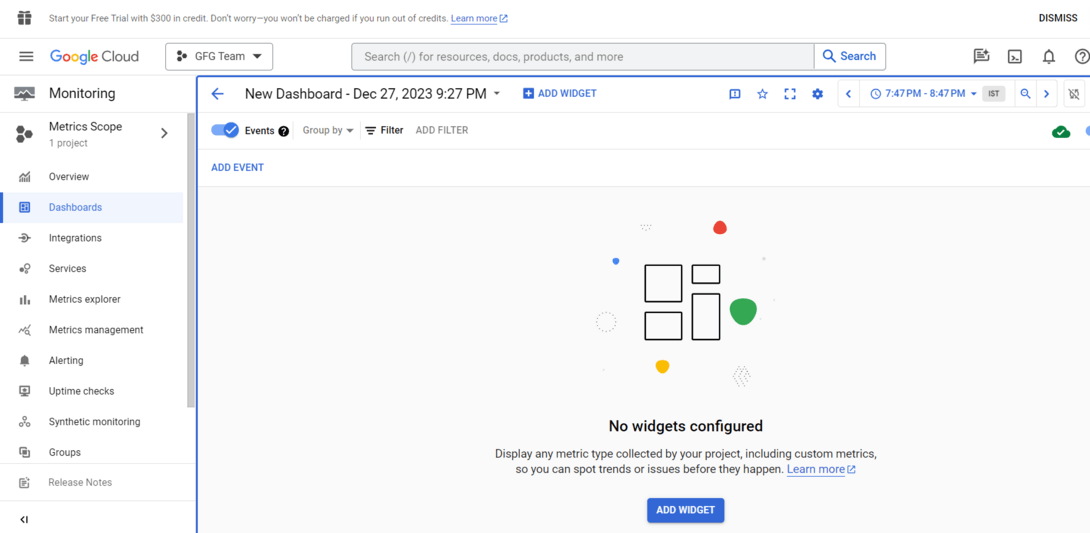
Add widgets and Chart
Step 3: Set Up Monitoring Alerts
In the Google Cloud Console, navigate to “Monitoring” > “Alerting.”
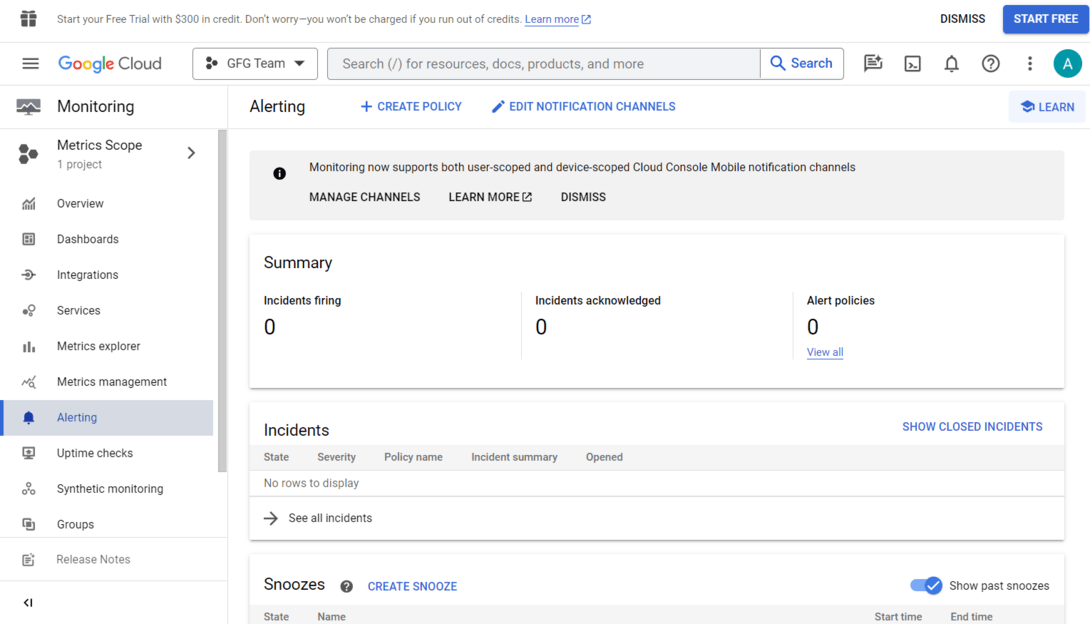
navigate to alerting
Click on “Create Policy.”
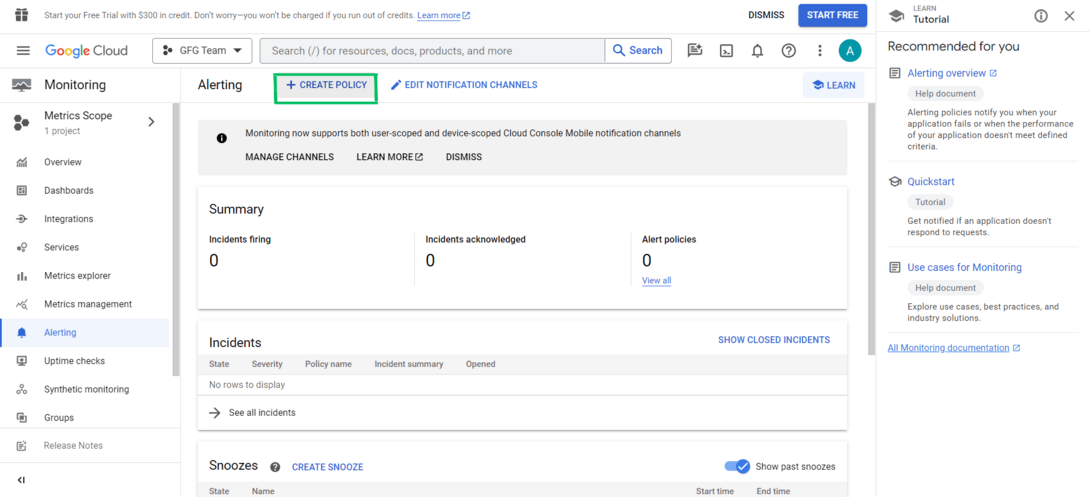
click on create policy
Configure the conditions in your alert (e.g., metric threshold).
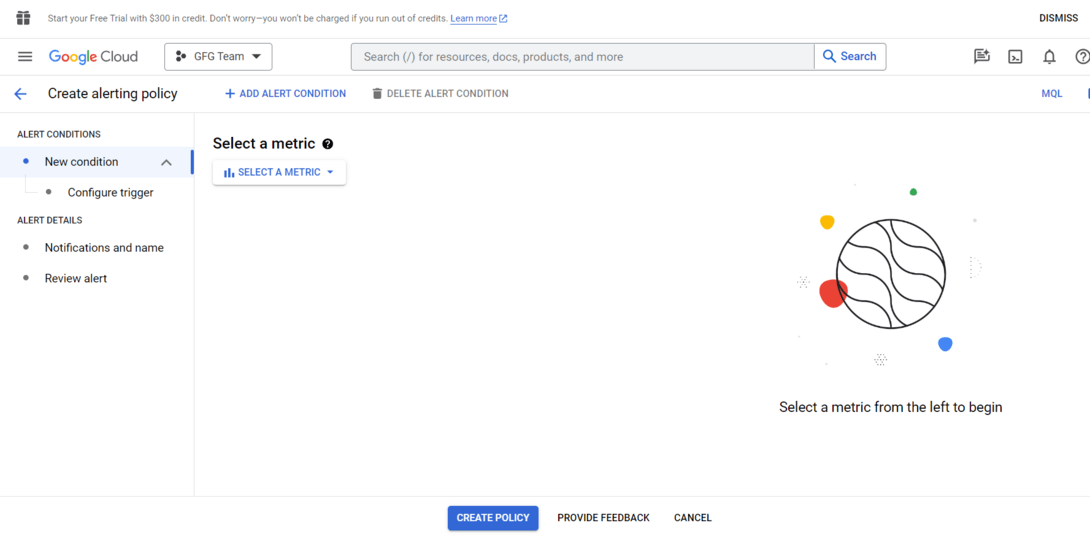
Configure the conditions in your alert
Set up notification channels (e.g., email, SMS, or Pub/Sub) for alert notifications.
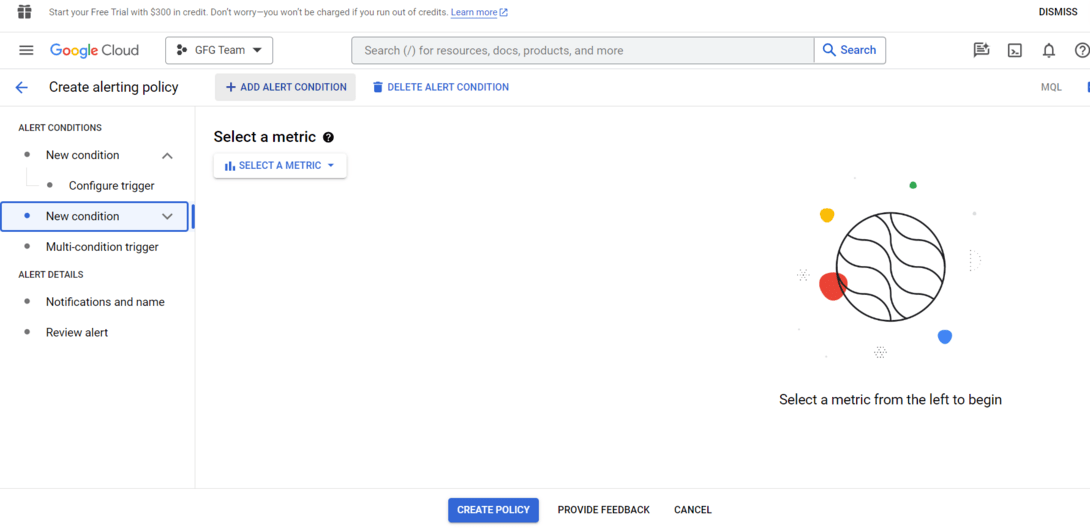
Add Alert Condition
What is Google Cloud Logging?
Google Cloud Logging, a part of the wider Stackdriver logging suite, makes a specialty of gathering, reading, and storing logs from numerous GCP services and programs. Logging is critical for troubleshooting, debugging, and maintaining a historic record of activities within your infrastructure.
Key Features
- Unified Log Management: Google Cloud Logging offers a centralized region for amassing logs from one-of-a-kind GCP services, supplying a unified view of your gadget’s activities. This simplifies the procedure of looking at and reading logs across multiple sources.
- Advanced Filtering and Searching: The platform offers superior filtering abilities, permitting users to look for specific log entries primarily based on standards inclusive of time variety, severity, or custom metadata. This makes it easy to pick out and examine applicable logs for debugging or auditing purposes.
- Log Exports: Google Cloud Logging helps export logs to diverse destinations, which includes Google Cloud Storage, BigQuery, and Pub/Sub. This flexibility lets organizations archive logs for compliance functions, perform advanced analytics, or combine logs with external structures.
- Integration with Monitoring: Google Cloud Logging can be integrated with Google Cloud Monitoring. This integration allows users to correlate logs with tracking metrics, provide the whole detail of overall performance, and provide efficient troubleshooting.
Google Cloud Logging (Step-by-Step Guide)
Step 1: Enable Logging API
In the Google Cloud Console, go to “APIs & Services” > “Dashboard.”
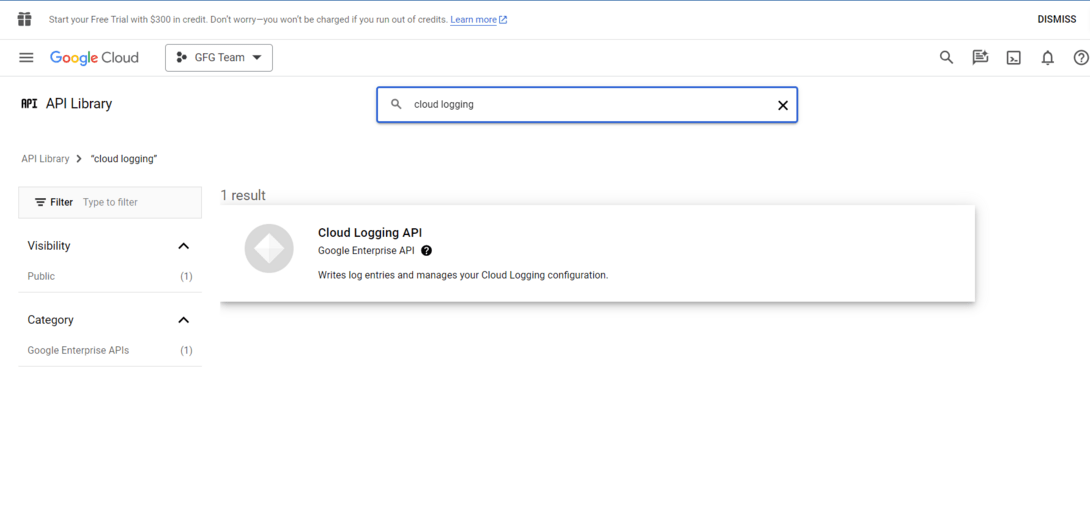
Click on “+ ENABLE APIS AND SERVICES.”
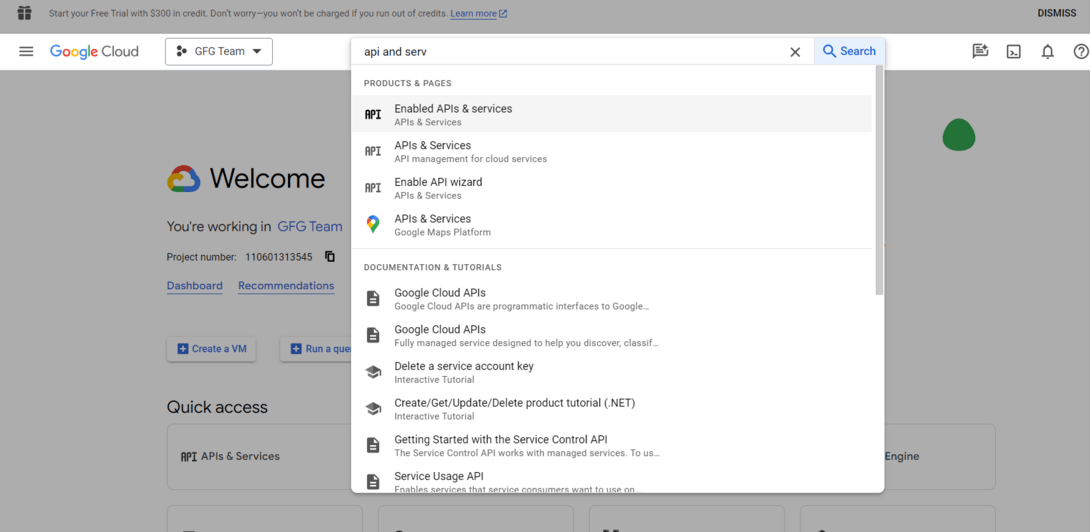
Search for “Cloud Logging API” and enable it.
Enable Cloud Logging API
Step 2: View Logs inside the Console
In the Google Cloud Console, navigate to “Logging” > “Logs Explorer.”
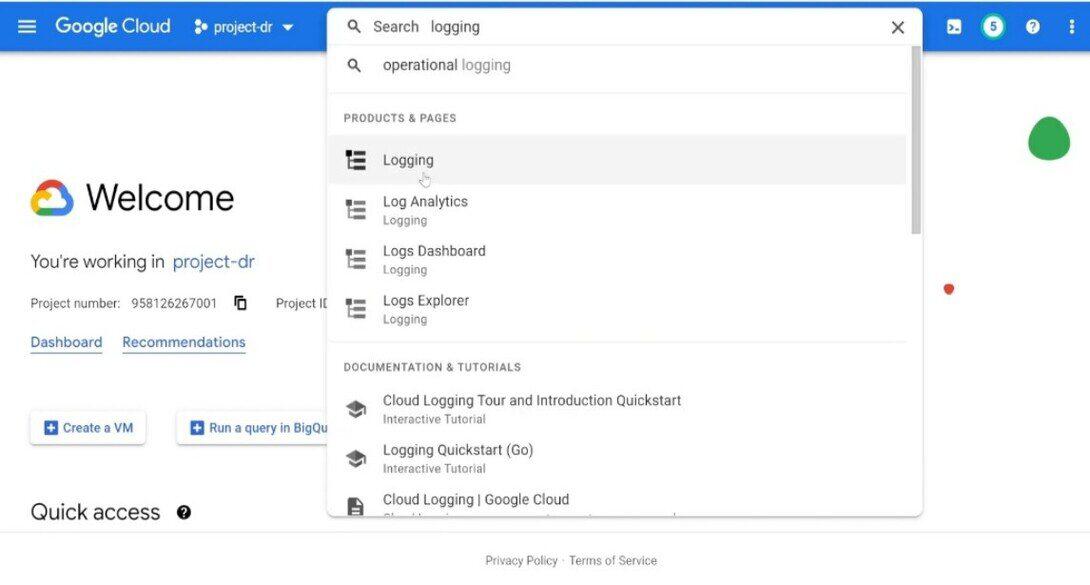
Navigate to “Logging”
Use the Logs Explorer to search, filter out, and examine logs generated by way of your GCP resources.
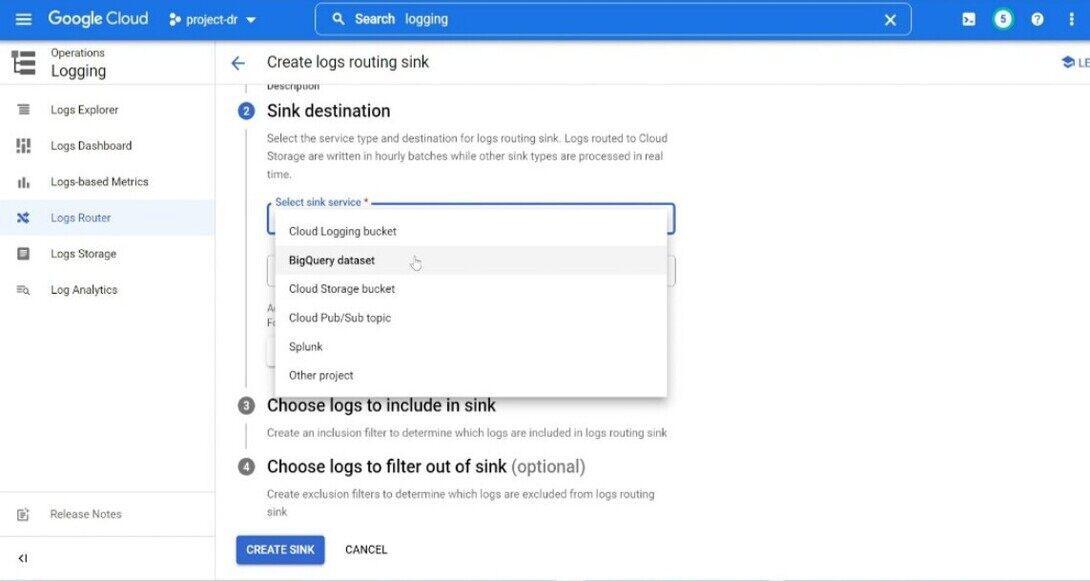
Step 3: Configure Log Exports
In the Google Cloud Console, go to “Logging” > “Exports.”Click on “Create Export.”Choose the log entries that you want to export and pick out a destination (for e.g., Cloud Storage, BigQuery).
Step 4: Use Logging in Code
Integrate logging into your application using your selected programming language. For example, in Python, you may use the google-cloud-logging library:
Python
from google.cloud import logging
client = logging.Client()
logger = client.logger('my-log')
logger.log_text('Hello, this is a log message.')
|
Use Cases and Examples
- Performance Optimization: Monitor software performance to identify bottlenecks and optimize code or infrastructure.
- Anomaly Detection: Implement anomaly detection to routinely discover unusual conduct or deviations from the norm.
- Security Incident Response: Use logs to investigate security incidents and set up a timeline of activities for powerful incident response.
- Resource Scaling: Utilize tracking metrics to dynamically scale sources primarily based on demand, ensuring ideal overall performance and price efficiency.
- Fault Detection and Diagnostics: Quickly detect faults by putting in alerts for critical errors and using logs for specific diagnostics at some stage in troubleshooting.
Integration with Third-Party Tools
- ServiceNow Integration: Integrate Google Cloud Monitoring and Logging with ServiceNow for streamlined incident management and backbone.
- PagerDuty Integration: Integrate with PagerDuty to enhance alert notifications and incident response abilities.
- Grafana Integration: Use Grafana for advanced visualization and information analysis, integrating it with Google Cloud Monitoring for a greater complete dashboard.
- ELK Stack Integration: Integrate Elasticsearch, Logstash, and Kibana (ELK Stack) for effective log evaluation and visualization abilities.
- Prometheus Integration: Leverage the compatibility of Google Cloud Monitoring with Prometheus for a robust monitoring and alerting solution.
Best Practices for Monitoring and Logging
- Define Clear Objectives: Clearly define the goal of your tracking and logging method. Understand what metrics and logs are important for your specific use case.
- Granular Alerting: Implement granular alerting to receive notifications for particular conditions. Avoid unnecessary alerts to save you from alert fatigue.
- Regularly Review and Update: Regularly evaluate and replace your monitoring and logging configurations. Systems and applications evolve, and so should your observability strategy.
- Utilize Custom Metrics and Logs: Take gain of custom metrics and logs to seize application-specific statistics. Tailor your monitoring to the specific traits of your system.
Conclusion
Google Cloud Monitoring and Google Cloud Logging play vital roles in GCP’s complete observability and management tools. By leveraging these services, groups can make certain the reliability, overall performance, and security of their applications and infrastructure on the Google Cloud Platform. Whether it’s real-time monitoring, proactive alerting, or in-intensity log evaluation, GCP’s monitoring and logging solutions empower users to maintain sturdy and resilient structures within the ever-evolving cloud environment.
Frequently Asked Questions(FAQs) on Google Cloud Monitoring & Google Cloud Logging
1. What is Google Cloud Monitoring, and How is it Advantageous for My Applications?
Google Cloud Monitoring is a service that provides actual-time visibility into the performance of your programs, services, and infrastructure on the Google Cloud Platform. It offers customizable dashboards, metrics exploration, and alerting capabilities, permitting you to proactively pick out and deal with problems, optimize resource usage, and ensure the overall health of your application.
2. How does Google Cloud Logging Assist in Troubleshooting and Retaining Machine Reliability?
Google Cloud Logging is part of the wider Stackdriver logging suite that collects, analyzes, and stores logs from various GCP services and programs. It allows you to troubleshoot issues by way of imparting a centralized location to search and filter out logs primarily based on precise criteria. By correlating logs with tracking metrics, it gives a comprehensive view of your system’s overall performance, aiding in debugging and maintaining device reliability.
3. Can Google Cloud Monitoring and Logging be Integrated with third-Party Tools?
Yes, Google Cloud Monitoring and Logging guide integration with third-party tools. You can seamlessly combine them with services like ServiceNow, PagerDuty, Grafana, ELK Stack (Elasticsearch, Logstash, Kibana), Prometheus, and numerous other solutions. These integrations enhance the competencies of monitoring, alerting, and log management, making an allowance for an extra tailor-made and comprehensive observability strategy.
4. How can I Export Logs from Google Cloud Logging, and what are the Potential Destinations?
Google Cloud Logging supports log export to diverse destinations, supplying flexibility for specific use cases. You can export logs to Google Cloud Storage for storage and archival, BigQuery for superior analytics, or Pub/Sub for streaming logs to external systems. This export capability guarantees that you may maintain logs for compliance, carry out in-depth analysis, and integrate logs with external tools or services.
Share your thoughts in the comments
Please Login to comment...