How To Reorder Boxplots in R with ggplot2?
Last Updated :
17 Oct, 2021
In this article, we will discuss how to reorder the boxplot with ggplot2 in R Programming Language.
To reorder the boxplot we will use reorder() function of ggplot2.
Syntax: ggplot(sample_data, aes(x=reorder(name,value),y=value))
By default, ggplot2 orders the groups in alphabetical order. But for better visualization of data sometimes we need to reorder them in increasing and decreasing order. This is where the reorder() function comes into play. We use reorder() function, when we specify x-axis variable inside the aesthetics function aes(). Reorder() function sorts the carriers by mean values of x-axis variable by default.
Example 1: Reorder in ascending order
In this example, the boxplot has been reordered using reorder() function. All the points of boxplots are arranged in increasing order of mean of their x-axis value.
R
library(tidyverse)
ggplot(diamonds, aes(x=reorder(cut,price), y=price)) +
geom_boxplot()
|
Output:
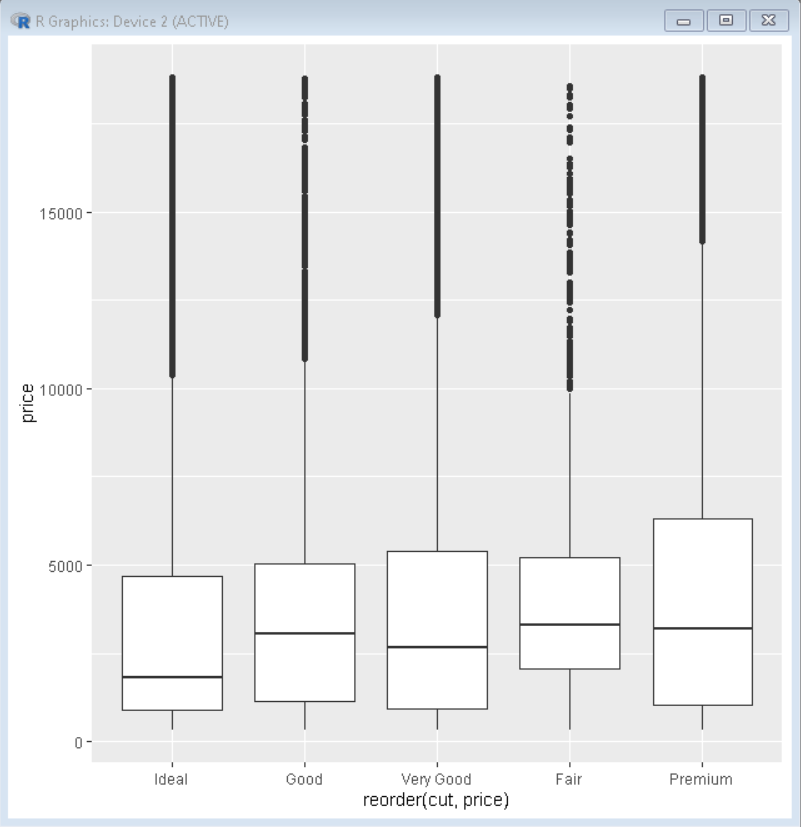
Here, in this boxplot, all the boxes are arranged in increasing order of mean of value price due to the use of the reorder() function.
Example 2: Reorder in descending order
To reorder the data in descending order, we pass the -ve value as an argument to reorder() function. This reorders the plot according to decreasing order of the mean value of data passed as a parameter.
R
library(tidyverse)
ggplot(diamonds, aes(x=reorder(cut, -price), y=price)) +
geom_boxplot()
|
Output:
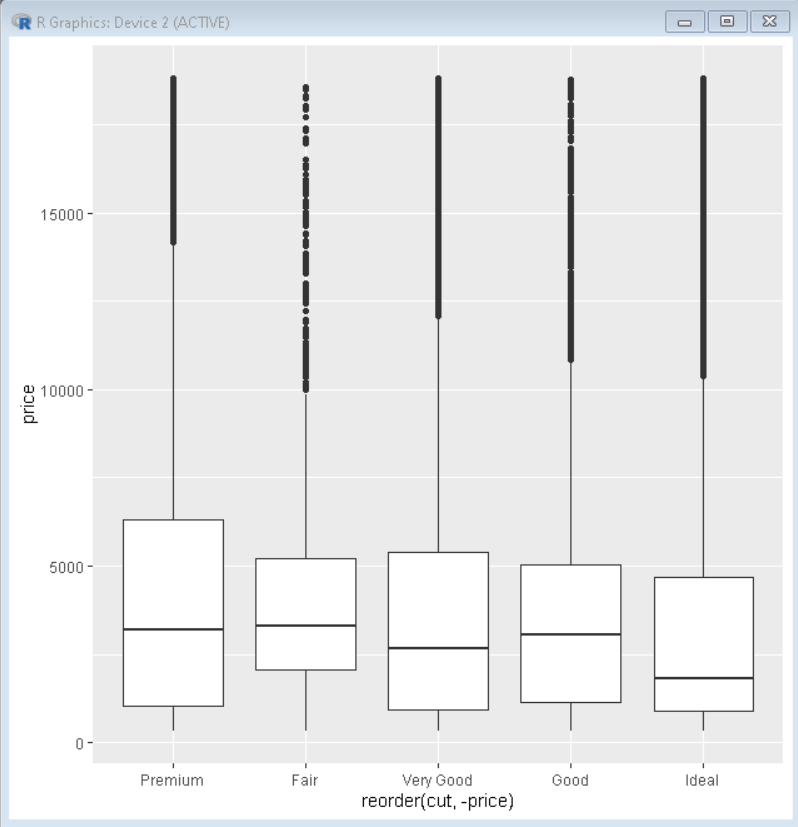
Here, in this boxplot, all the boxes are arranged in decreasing order of mean of value price due to the use of the reorder() function.
Share your thoughts in the comments
Please Login to comment...