How To Make Boxplots with Text as Points in R using ggplot2?
Last Updated :
03 Dec, 2021
In this article, we will discuss how to make boxplots with text as points using the ggplot2 package in the R Programming language.
A box plot is a chart that shows data from a five-number summary including one of the measures of central tendency. These five summary numbers are Minimum, First Quartile, Median, Third Quartile, and Maximum which helps us in analyzing different statistical measures through visual representation.
To import & install ggplot2 package, we need to follow the below syntax:
install.package('ggplot2') # To install
import('ggplot2') # To import
Create Basic Boxplot
We can create a basic boxplot by using the geom_boxplot() function of the ggplot2 package in the R Language.
Syntax:
ggplot(dataframe, aes( x, y, color ) ) + geom_boxplot()
Example:
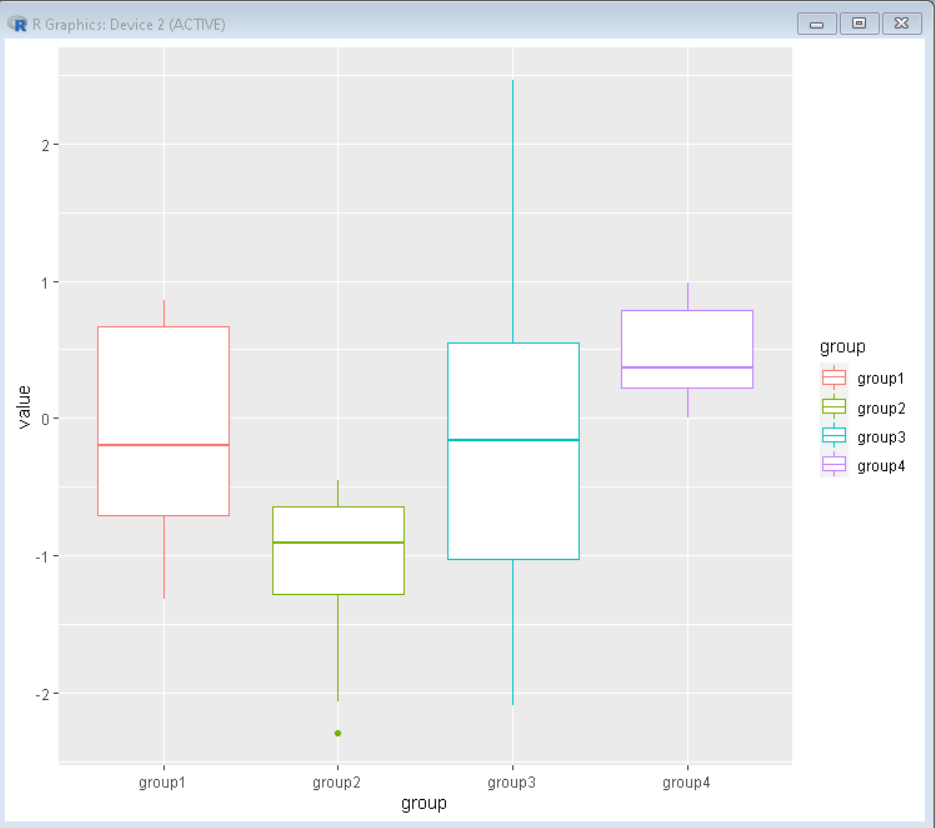
In this example, a basic boxplot is made using the geom_boxplot function of the ggplot2 package.
The CSV file used in the example can be downloaded here.
R
library(ggplot2)
sample_data <- read.csv("df.csv")
ggplot(sample_data, aes(x=group, y=value, color=group))+
geom_boxplot()
|
Output:
Adding Data Points as Overlay:
To add jittered data points as an overlay to the boxplot, we will use the geom_jitter() function of the ggplot2 package. This function adds a layer over the boxplot with actual points plotted over it.
Syntax:
ggplot(dataframe, aes( x, y, color ) ) + geom_boxplot() + geom_jitter()
Parameters:
- x is categorical variable
- y is quantitative variable
- z is categorical variable used in the color plot by the group.
Example:
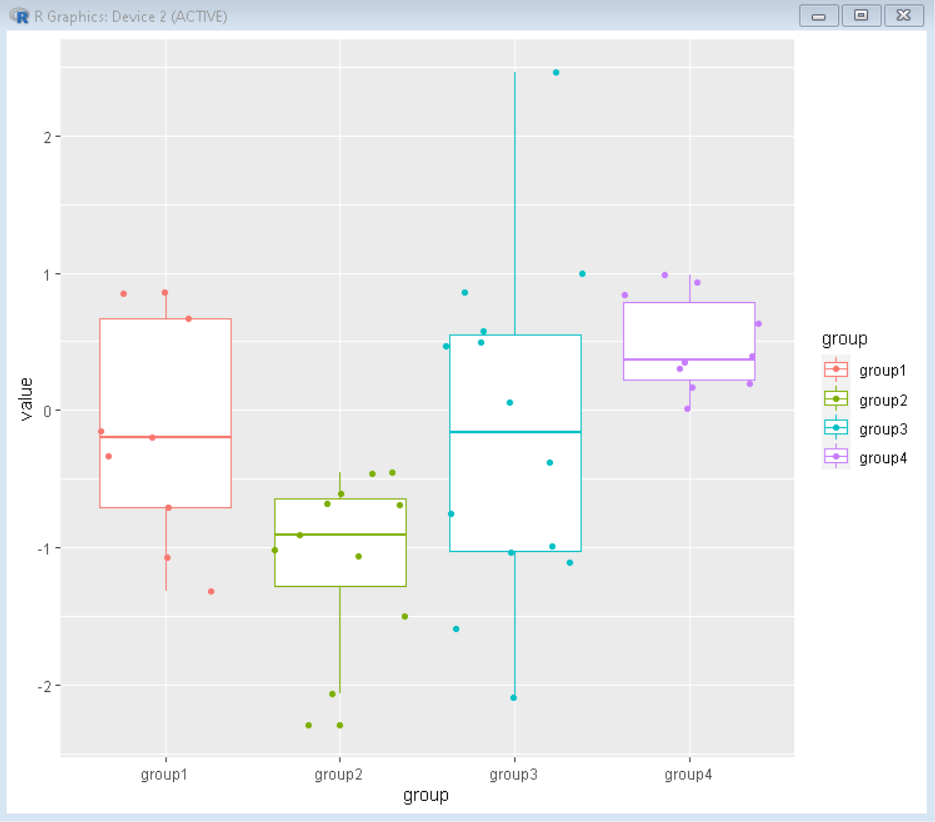
In this example, a boxplot is made using the geom_boxplot function of the ggplot2 package. The actual data points are overlayed to boxplot using geom_jitter() function.
R
library(ggplot2)
sample_data <- read.csv("df.csv")
ggplot(sample_data, aes(x=group, y=value, color=group))+
geom_boxplot()+
geom_jitter()
|
Output:
Replacing data points with labels
Now to analyze the data we will replace the data points with their respective labels using the geom_text() function with parameter position. The geom_text() function replaces the data points with data labels but all labels come in a straight line. To make it jittered, we use the position parameter as position_jitter().
Syntax:
ggplot(dataframe, aes( x, y, color ) ) + geom_boxplot() + geom_text( position= position_jitter() )
Example:
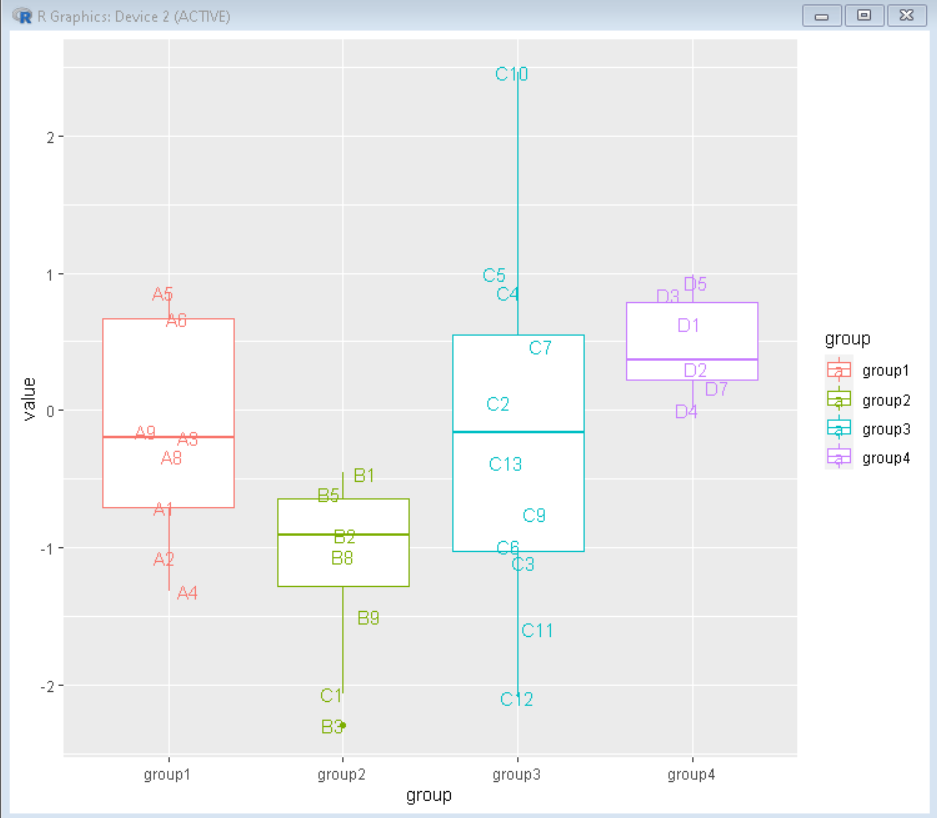
Here, The actual data points are overlayed to boxplot as the label text using geom_text() function.
R
library(tidyverse)
sample_data <- read.csv("df.csv")
ggplot(sample_data, aes(x=group,y=value, label = Label, color=group))+
geom_boxplot()+
geom_text(check_overlap = TRUE, position=position_jitter(width=0.15))
|
Output:
Like Article
Suggest improvement
Share your thoughts in the comments
Please Login to comment...