Plot multiple boxplots in one graph in R
Last Updated :
23 May, 2021
In this article, we will learn how to plot multiple boxplot in one graph in R Programming Language. This can be accomplished by using boxplot() function, and we can also pass in a list, data frame or multiple vectors to it. For this purpose, we need to put name of data into boxplot() function as input.
Syntax: boxplot(x, data, notch, varwidth, names, main)
Parameters:
- x: This parameter sets as a vector or a formula.
- data: This parameter sets the data frame.
- notch: This parameter is the label for horizontal axis.
- varwidth: This parameter is a logical value. Set as true to draw width of the box proportionate to the sample size.
- main: This parameter is the title of the chart.
- names: This parameter are the group labels that will be showed under each boxplot.
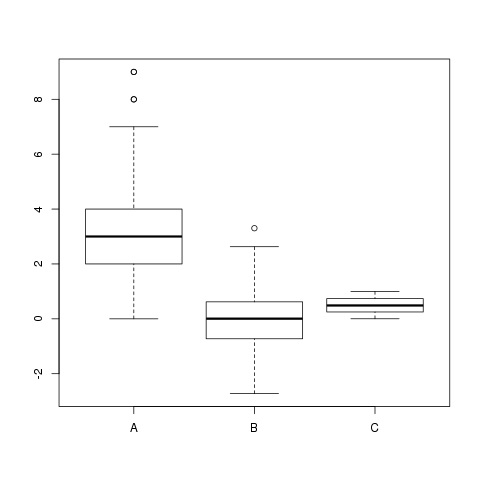
Multiple vertical boxplots in one frame
For this, the individual data for which a boxplot representation is required is based on the function. By default, the orientation of the boxplots will be vertical hence nothing extra needs to be done here.
Example 1:
R
set.seed(20000)
data <- data.frame( A = rpois(900, 3),
B = rnorm(900),
C = runif(900)
)
boxplot(data)
|
Output:
Example 2:
R
boxplot( len~dose,
data=ToothGrowth,
main="Different boxplots for per day growth",
xlab="Tooth length",
ylab=" numeric Dose in milligrams/day",
col="blue",
border="black"
)
|
Output:

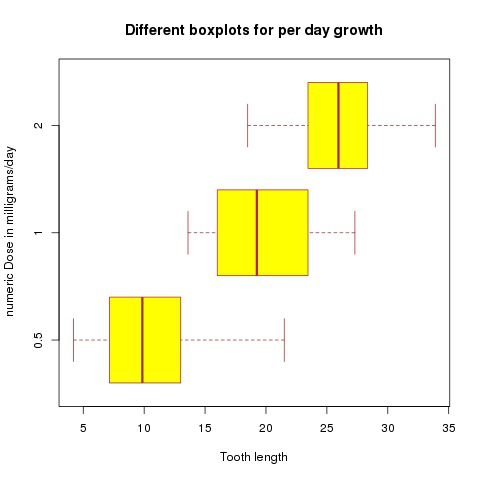
Multiple horizontal boxplots in one frame
The approach is the same as for vertical boxplots but to make them work horizontally, the horizontal parameter of the boxplot() function has to be set TRUE.
Example:
R
boxplot(len~dose,
data=ToothGrowth,
main="Different boxplots for per day growth",
xlab="Tooth length",
ylab=" numeric Dose in milligrams/day",
col="yellow",
border="brown",
horizontal=TRUE
)
|
Output:
Share your thoughts in the comments
Please Login to comment...