How to increase font size in Base R Plot ?
Last Updated :
17 Jun, 2021
The plot() method in the R programming language is used to plot a series of points in the graph and visualize them using curves and scatter that they follow.
Syntax:
plot(x, y, main=”title”, sub=”subtitle”)
The cex attribute is the integer which is an indicator of the scale factor, which describes the amount by which the elements of the plot can be scaled. The default value is 1, 0.5 reduces it by 50%, etc. The cex parameter may have whole numbers or decimal values.
The main title can be added in the plot to convey more features using the main option in the plot method, whereas, the subtitle can be added using the sub-attribute. The size of the main title heading can be modified using the cex.main option and subtitle using the cex.sub option respectively.
| option |
Description |
| cex.axis |
magnification of axis annotation |
| cex.lab |
magnification of x and y labels of the axes |
| cex.main |
magnification of main title |
| cex.sub |
magnification of subtitle |
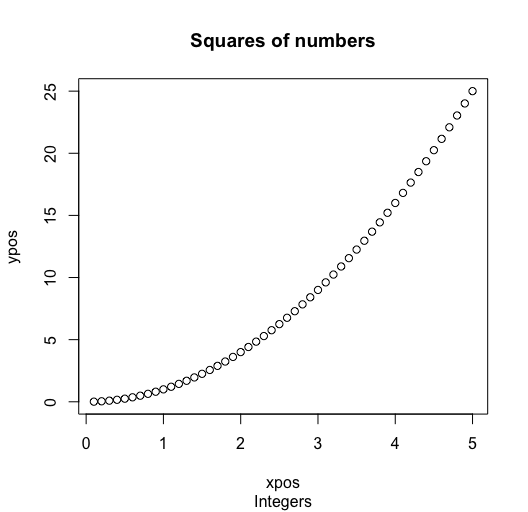
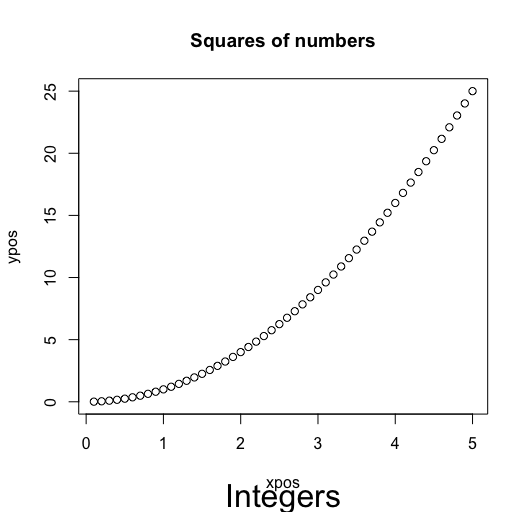
The following graph has been used for reference to create the different components scaled to font size = 1 by default. It displays the graph for the equation y = x2, where the x values have been created using the seq() function in R. This helps to understand the graph better and the difference is also apparent.
Example:
R
xpos <- seq(0.1 , length.out = 50,by = 0.1)
ypos <- xpos**2
main_title <- "Squares of numbers"
plot(xpos, ypos, main = main_title)
|
Output:
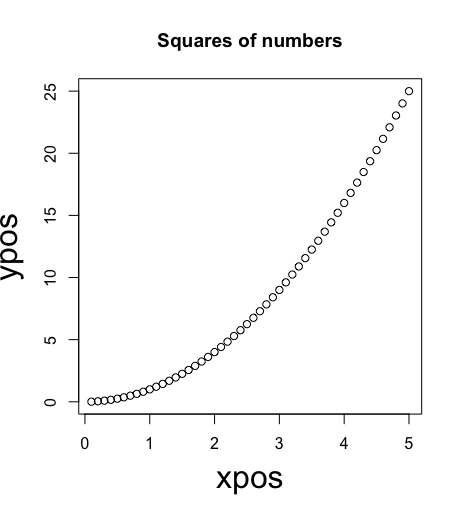
Increasing the font size of labels
The cex.lab attribute can be used to modify the font size of the labels of the both (x and y) axes. The following code snippet illustrates the procedure of making labels’ font size double.
Example:
R
xpos <- seq(0.1 , length.out = 50,by = 0.1)
ypos <- x**2
main_title <- "Squares of numbers"
plot(xpos, ypos, main = main_title, cex.lab = 2)
|
Output:
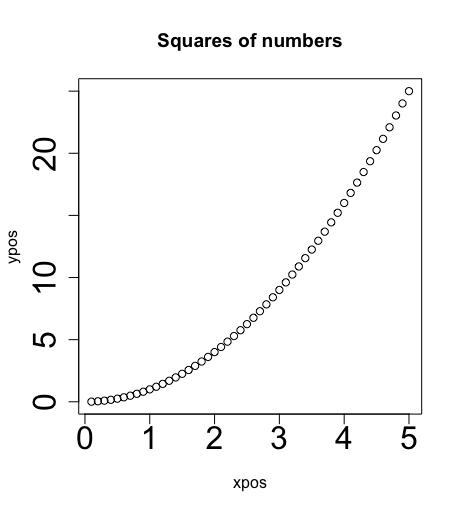
Increasing the font size of axes
The cex.axes attribute can be used to modify the font size of the axis tick labels. Just pass the value you want the font to be increased with.
Example:
R
xpos <- seq(0.1 , length.out = 50,by = 0.1)
ypos <- xpos**2
main_title <- "Squares of numbers"
plot(xpos, ypos, main = main_title, cex.axes = 2)
|
Output:
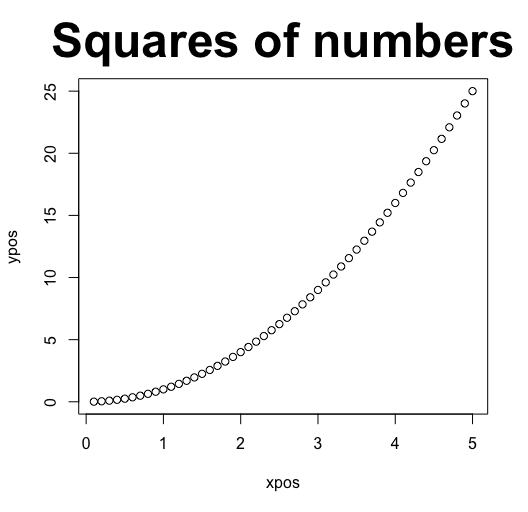
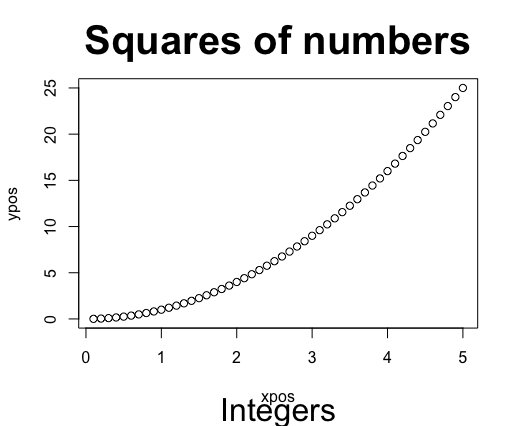
Increasing the font size of main title
The cex.main attribute can be used to modify the font size of the main title specified for the graph.
Example:
R
xpos <- seq(0.1 , length.out = 50,by = 0.1)
ypos <- xpos**2
main_title <- "Squares of numbers"
plot(xpos, ypos, main = main_title, cex.main = 2)
|
Output:
Increasing the size of sub heading
The cex.sub attribute can be used to modify the font size of the subtitle specified for the graph.
Example:
R
xpos <- seq(0.1 , length.out = 50,by = 0.1)
ypos <- xpos**2
main_title <- "Squares of numbers"
sub_title <- "Integers"
plot(xpos, ypos, main = main_title , sub= sub_title , cex.sub = 2)
|
Output:
Increasing all the properties of the graph
To increase the size of properties, all the properties with their respective values are passed to the function.
Example:
R
xpos <- seq(0.1 , length.out = 50,by = 0.1)
ypos <- xpos**2
main_title <- "Squares of numbers"
sub_title <- "Integers"
plot(xpos, ypos, main = main_title , sub= sub_title , cax.lab = 1.9,
cex.axes = 1.52, cex.main = 2.5, cex.sub = 2)
|
Output
Share your thoughts in the comments
Please Login to comment...