Change Spacing of Axis Tick Marks in Base R Plot
Last Updated :
28 Apr, 2021
In this article, we are going to see how to modify the space between axis tick marks of a Base R plot in R programming.
It can be done in the following ways:
- Using xaxp & yaxp method.
- Using axis() Function.
Method 1: Using xaxp & yaxp method
The first tick mark, last tick, and a number of tick mark parameters are given represented by a,b,c shown in the below syntax. These parameters are put into used to change in spacing between axis ticks in the base plot.
Syntax: plot(x, y, xaxp = c(a,b,c), yaxp = c(a,b,c))
Parameters :
- a= first tick mark
- b= last tick mark
- c= Number of tick marks
Example:
R
y <- 1:80
x <- 1:80
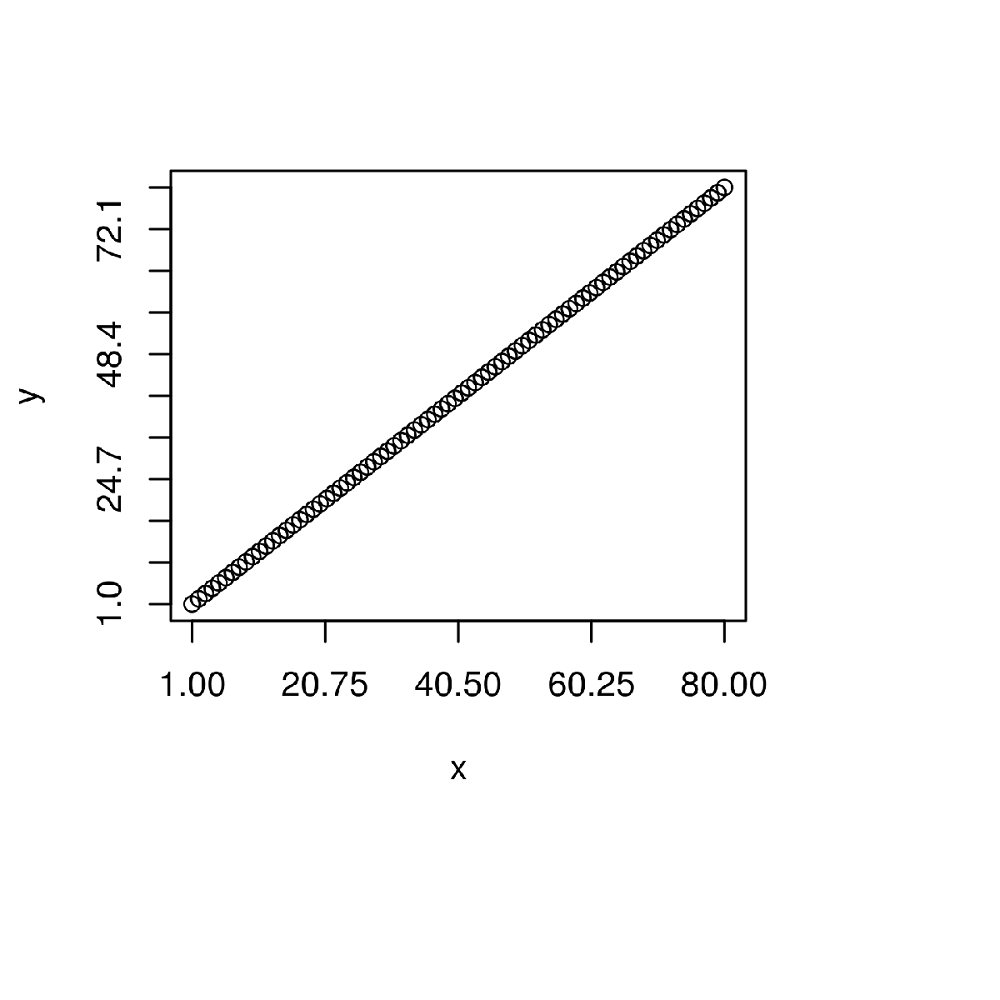
plot(x, y,
xaxp = c(1, 80, 4),
yaxp = c(1, 80, 10))
|
Output:
Method 2: Using axis function.
In this method, first, there is a need to create a plot without axis ticks. Then, add ticks by applying the axis() function. Different ticks are added in the way as represented by a, b, c parameters in syntax. So, this is one such method to change the spacing between axis ticks in Base R Plot.
Syntax:
plot(x, y, xaxt = “n”,yaxt = “n”)
axis(side = 1, at = c(a, b, c….))
axis(side = 2, at = c(a, b, c…..))
Parameters:
a, b, c = values of axis ticks
Example:
R
y <- 1:120
x <- 1:120
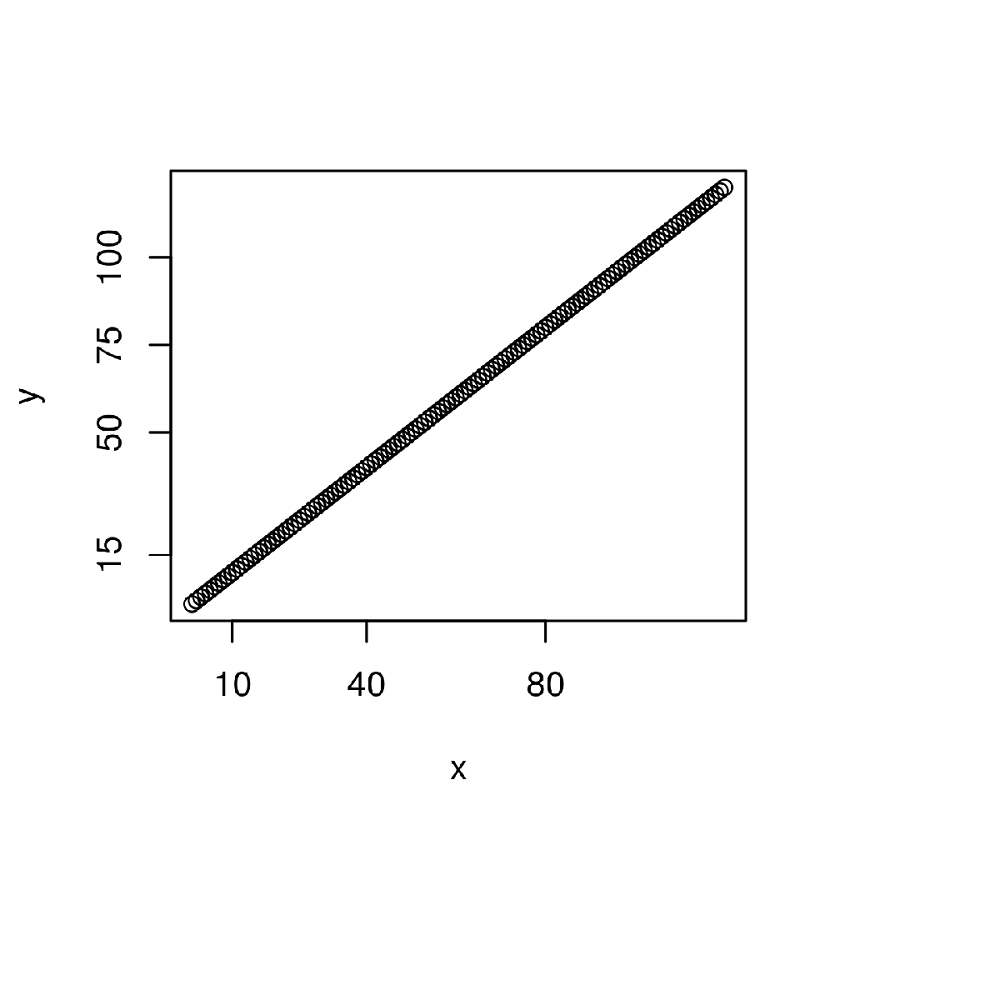
plot(x, y,
xaxt = "n",
yaxt = "n")
axis(side = 1, at = c(10, 40, 80))
axis(side = 2, at = c(15, 50, 75, 100))
|
Output:
Share your thoughts in the comments
Please Login to comment...