How to increase spacing between faceted plots using ggplot2 in R ?
Last Updated :
24 Jun, 2021
In this article, we will see how to increase spacing between faceted plots using ggplot2 in R Programming language.
Note: Here, a line plot has been used the same can be done for any other plot.
To create an R plot, we will use ggplot() function and to make a line graph add geom_line() function to it. Finally, for facet grids, we will use facet_grid() function.
Syntax : facet_grid(facets)
Parameter :
- facets : Generally facet_grid have many parameters but facets are necessary to specify in which we assign rows and columns where we want grid. As in above syntax, we use Labels vector for rows and nothing for columns. When we have Nothing to specify then we use ‘.’ as here we use facet_grid(Labels ~ .) .
Return : Layout panels in a grid.
Let us first plot the initial graph so that the difference is apparent.
Example:
R
library("ggplot2")
DF <- data.frame(X = rnorm(200),
Y = rnorm(200),
Labels = c("Label 1", "Label 2",
"Label 3", "Label 4"))
ggplot(DF, aes(X, Y)) +
geom_line(color = "dark green") +
facet_grid(Labels ~ .)
|
Output:
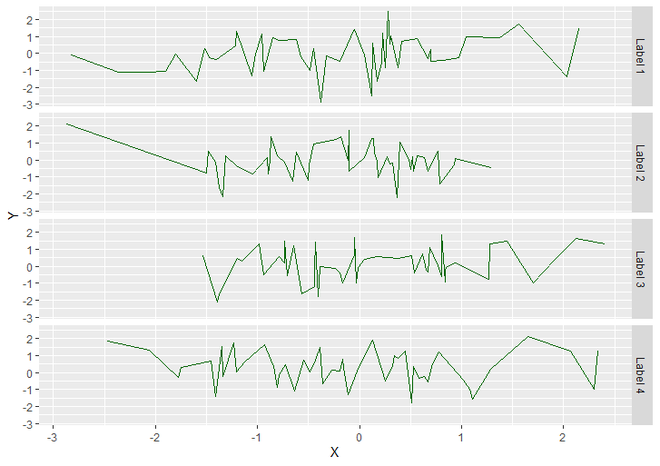
FacetPlot using ggplot2
As you can see in above graph that there is some space between facet grids which is around 0.2 cm By Default. To increase it, add theme() function to facet_grid function. Inside theme() pass required values to the panel.spacing parameter.
Syntax : theme(panel.spacing)
Parameter :
- panel.spacing : Generally, theme() has many parameters to specify the theme of plot. we can use them as per our requirements but for change the space between Facets, we will use only panel.spacing parameter. which is used to specify spacing between facet panels. Here we use unit() function as a value of panel.spacing parameter for unit object.
Return : Theme of the plot.
unit() is used to create a unit object. This will be passed as the value to panel.spacing.
Syntax : unit(x, unit, data = NULL)
Parameters :
- x : A Numeric Value. Here we want to increase the space between panels from default space to 2 cm. So, here we assign x as 2 .
- unit : A character specifying the units for the corresponding numeric values. Here we use cm unit.
- data : specifying extra information otherwise NULL .
Return : Unit Object
Example:
R
library("ggplot2")
DF <- data.frame(X = rnorm(200),
Y = rnorm(200),
Labels = c("Label 1", "Label 2",
"Label 3", "Label 4"))
ggplot(DF, aes(X, Y)) +
geom_line(color = "dark green") +
facet_grid(Labels ~ .) +
theme(panel.spacing = unit(2, "cm", data = NULL))
|
Output:
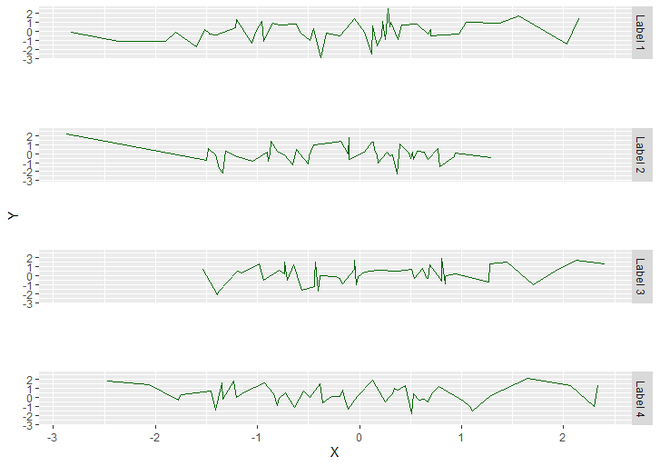
FacetPlot with increased space between Facet Panels
Share your thoughts in the comments
Please Login to comment...