How to set font size of Matplotlib axis Legend?
Last Updated :
05 Nov, 2021
Prerequisite: Matplotlib
In this article, we will see how to set the font size of matplotlib axis legend using Python. For this, we will use rcParams() methods to increase/decrease the font size. To use this we have to override the matplotlib.rcParams[‘legend.fontsize’] method.
Syntax: matplotlib.rcParams[‘legend.fontsize’] = font_size_value
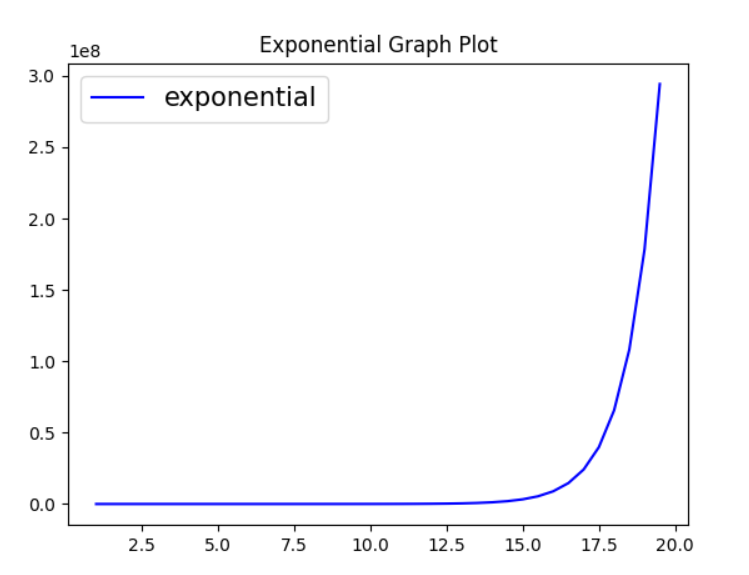
Example 1: Setting plot size of the legend is 15
Python3
import numpy
from matplotlib import pyplot
import matplotlib
x_axis = numpy.arange(1, 20, 0.5)
y_axis_log10 = numpy.exp(x_axis)
pyplot.plot(x_axis, y_axis_log10, c="blue",
label="exponential")
pyplot.title("Exponential Graph Plot")
matplotlib.rcParams['legend.fontsize'] = 15
pyplot.legend(loc='best')
pyplot.show()
|
Output:
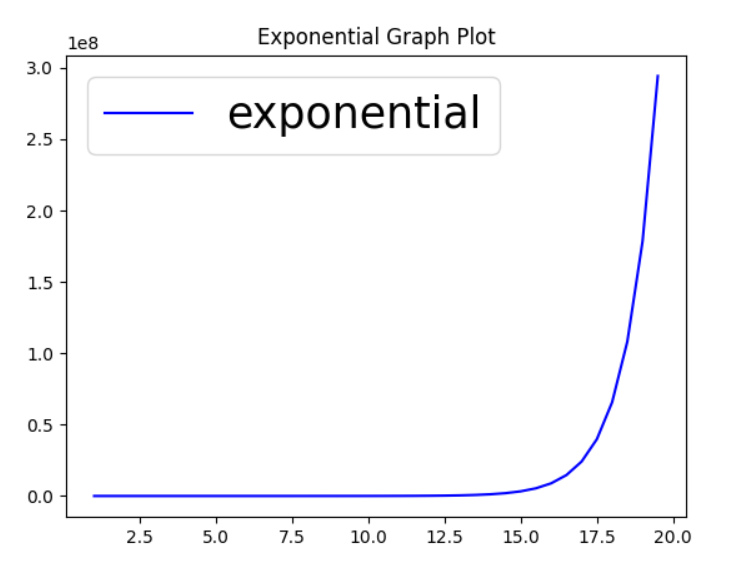
Example 2: Setting the plot size of the legend is 25
Python3
import numpy
from matplotlib import pyplot
import matplotlib
x_axis = numpy.arange(1, 20, 0.5)
y_axis_log10 = numpy.exp(x_axis)
pyplot.plot(x_axis, y_axis_log10, c="blue", label="exponential")
pyplot.title("Exponential Graph Plot")
matplotlib.rcParams['legend.fontsize'] = 25
pyplot.legend(loc='best')
pyplot.show()
|
Output:
Share your thoughts in the comments
Please Login to comment...